Managing Gross Profit vs. Holding Costs: The Real Cost of Aging Inventory
Used car holding costs with the math shown: floor-plan interest, fees, market slide, and markdowns, and how a $3,000 gross car becomes a $500 car by day 90.
Part of the Inventory, pricing & aging guide: Inventory Turn Rate for Used Car Dealers: Benchmarks, Formula & How to Improve
Switching from another DMS? Compare DealerVLO to DealerCenter, Frazer, or Lot Wizard.
Every day a car sits on your lot, it costs you money. Used car holding costs don't show up on the windshield, but they're eating your front-end gross one day at a time, and most dealers underestimate how fast it happens. The unit you bought expecting a $3,000 profit can turn into a $500 win or a break-even by day 90, not because the market crashed but because interest, fees, the market's slow slide, and curtailment pressure compounded while you waited for the right buyer.
The math is simple once you see it. This post walks through the four cost components that drain profit, works the break-even calculation with every number shown, and lays out the timelines that separate a win from a wholesale fire sale.
Note: This article discusses holding-cost math. It is not financial or legal advice. Consult your lender, accountant, and state regulator for guidance specific to your operation.
14-day free trial, then $29/mo · Cancel anytime
The four components of used car holding costs
When you carry inventory on a floor plan, four costs run simultaneously. Most dealers track interest, but the other three are just as real.
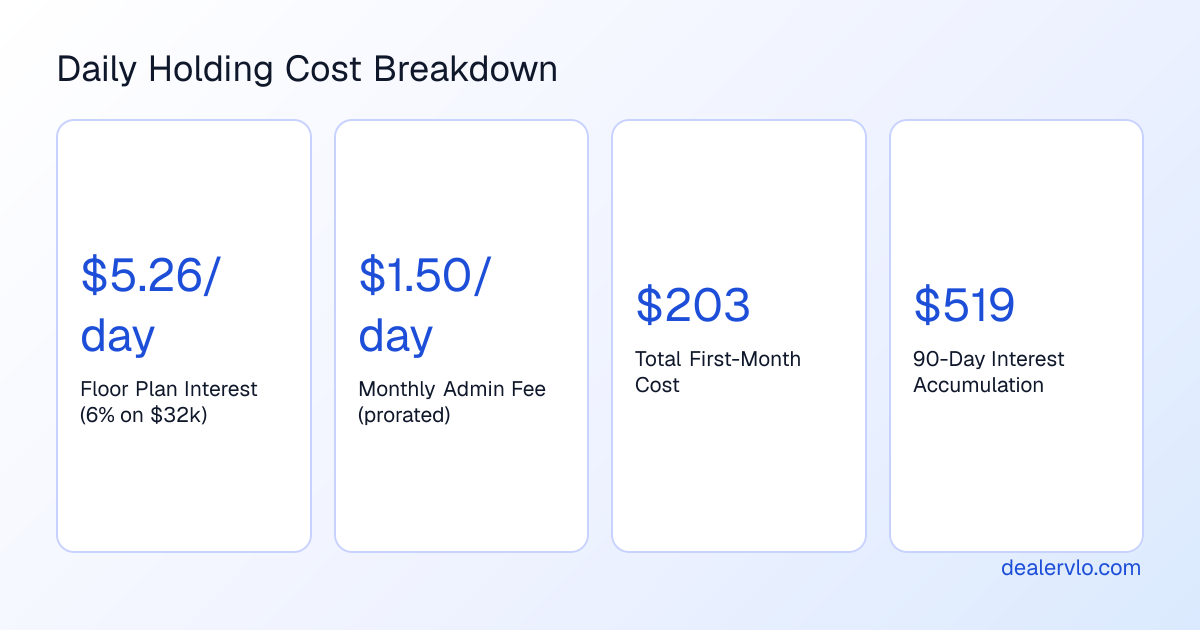
Floor plan interest and fees. Providers don't publish standard rates; NextGear, AFC and Westlake each quote yours on your credit, time in business and volume (what each one does publish). Interest accrues daily: the amount financed times your APR, divided by 365. As an example, at 9 percent on a $32,000 SUV you're paying about $7.89 a day, or about $237 a month. Add an example $45 monthly fee and the first month costs about $282 just to keep the keys. Flat per-car fees, audit fees and extension fees sit on top.
If you want to understand how dealer floor plans work in detail, we've covered the mechanics separately; this post focuses on the cost penalty.
Depreciation is the silent killer. While a car sits, the market value of that year, make and model keeps sliding, and to stay priced to market you give that slide back in markdowns. How fast it slides depends on the segment and the season, so measure it from recent comparable listings and your own sales rather than assuming a national number. Once a unit passes 30 to 45 days, you're usually repricing to catch up with a market that moved without you.
Lot space, insurance and overhead. Rent, insurance on the inventory, utilities and staff don't care which car is on the lot, but each space holding a 90-day unit is a space that can't hold fresh inventory. Allocate a per-car share from your own P&L so you can see it.
Opportunity cost is harder to quantify but often the most expensive. Aged stock ties up working capital that could otherwise go toward acquiring better units or reconditioning the ones you have. When too many units go stale, it becomes harder to predict sales velocity, margin, or even staffing.
The break-even calculation: when $3,000 gross becomes $500
Here's the scenario every independent used-car dealer knows but hates to admit: you buy a clean mid-size SUV at auction for $32,000, priced to pencil to a $3,000 front-end gross, and you floor it. The first 15 days are quiet, so you hold. At 30 days you knock $400 off the asking price to generate activity. At 45 days you're fielding lowball offers. At 60 days your lender starts asking questions. At 90 days a curtailment is due, and the margin you thought you had is mostly gone.
Put numbers on it. Every figure below is an example; swap in your own.
- Interest and fees: $32,000 at 9 percent is about $7.89 a day. Over 90 days that's about $710, plus three months of an example $45 fee ($135): about $845.
- Market slide: say this segment is losing about 1 percent of its value a month. On $32,000 that's $320 a month, so staying priced to market costs about $960 in markdowns by day 90.
- The extra cut: the $400 you took at day 30 to stir up activity: $400.
- Overhead: say $100 a month of lot, insurance and overhead allocated to this car: $300.
$3,000 − $845 − $960 − $400 − $300 = about $495. That's how a $3,000 car becomes a $500 car without anything dramatic happening. And if the curtailment comes due before it sells, you also owe a chunk of principal in cash on a car that hasn't sold.
Run the same car to a 30-day sale and the picture is different: about $282 in interest and fees, about $320 of market slide, and $100 of overhead, which leaves about $2,300 of the $3,000. The 60 days between those two outcomes cost about $1,800. That's not a rounding error; multiply it across your lot and it's the difference between a strong month and a mediocre one.
Put a real dollar-a-day number on every unit sitting on your lot.
Open the Holding Cost CalculatorThe fix is knowing your own days to sale by type of car and buying and pricing to beat it. For more on tracking and improving turn rate, see our guide to inventory turn rate for used car dealers.
The penalty timeline: what happens at 30, 60, and 90 days
The cost doesn't feel linear. It feels like it accelerates, because the markdowns stack on top of the daily costs. Here's what the penalty zone looks like in practice.
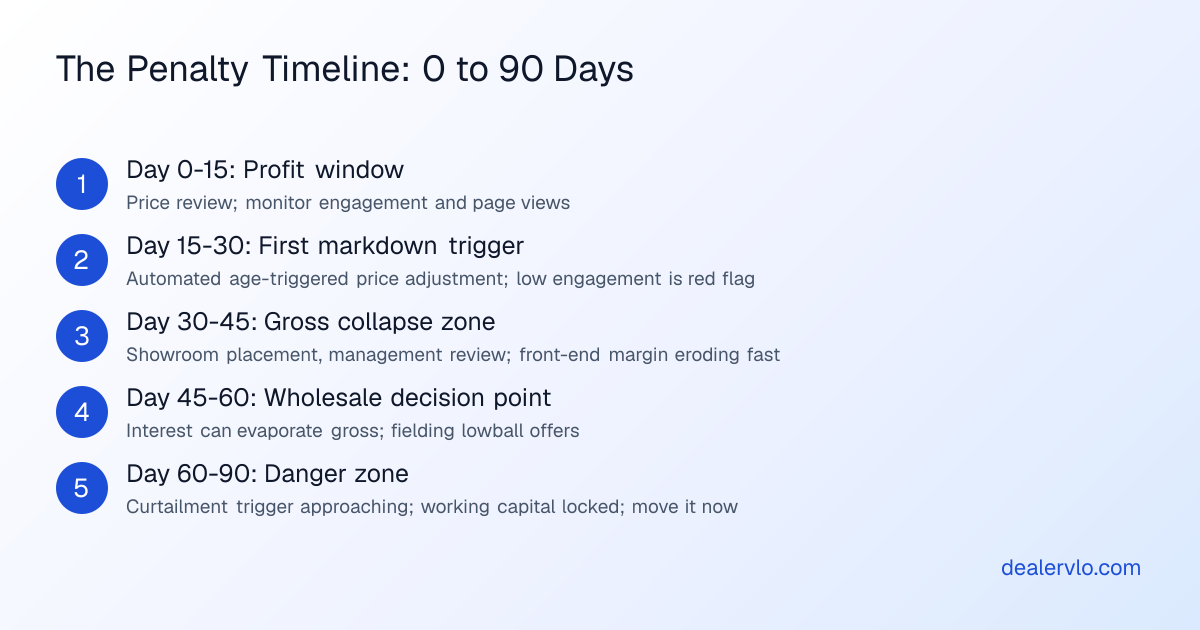
Day 0 to 30: This is your profit window. If you priced it right and photographed it well, a good unit moves in this range with minimal holding cost. Review the price around day 15 even if you don't change it, and watch engagement: page views, calls, test drives. Low engagement at day 20 is a red flag that your price, photos, or vehicle choice missed the market.
For a systematic approach to markdowns, our post on inventory aging markdown strategy covers the triggers and thresholds that keep you ahead of the penalty zone.
Day 30 to 60: Front-end gross starts to erode for real. Once a vehicle hits 30 days, give it a management review and team-wide visibility. Assume something is wrong (price, presentation, or vehicle selection) and fix it or move it. By day 45 the offers coming in are below ask, and you have to decide whether to take the hit now or gamble on the next two weeks bringing a full-price buyer.
Interest keeps accruing, the market keeps sliding, and shoppers scrolling your listings start to notice. They see the same car week after week and wonder what's wrong with it. The result is lower engagement and a weaker negotiating position even when a buyer does show up.
Day 60 to 90: You're in the danger zone. Curtailments come due at the end of each term: an unsold car means a fee plus a paydown of part of the principal (AFC describes it as an extension "for a fee and payment of a predetermined percentage of the loan's principal"). The longer a vehicle sits, the more of your working capital gets locked into a depreciating asset.
At this point your options are wholesale it at auction and recover what you can, sell it to a buyer who specializes in aged inventory (usually at a steep discount), or keep paying and hope. The last option rarely pencils.
Three things that make holding costs bite
Floor plan rates went up again. On September 16, 2026, the Fed raised its benchmark a quarter point, and variable floor plan lines priced off prime or SOFR follow it. Per car, a quarter point is small, but it adds up on every unit that sits; the per-car math is here.
If you're debating whether to floor or pay cash, the rate changes the math; our floor plan vs. cash decision framework walks through the breakpoints.
Used-car values don't sit still. What matters for holding cost isn't an index headline; it's how fast your specific unit loses value while it sits, which varies by segment and season. Check comparable listings on your aged units every couple of weeks so the markdowns don't surprise you.
Overhead doesn't shrink when gross does. Your rent, payroll and insurance are the same whether a car sells in 20 days or 90. As an example, a lot selling 30 cars a month at $3,000 gross brings in $90,000 a month in gross profit; lose $2,000 on each of five aged units and $10,000 of that is gone before overhead. Every dollar lost to holding cost comes straight out of what's left after the bills.
14-day free trial, then $29/mo · Cancel anytime
What to stock and how to source it
The best defense against holding costs is buying the right inventory in the first place. The difference between a 30-day car and a 90-day car is often visible before you bid.
Stock what moves in your market. That sounds obvious, but buying what's cheap at auction instead of what your customers actually want is how a lot fills up with aged units. A $12,000 sedan with great margin looks like a win until it sits for 75 days because your market buys trucks. Our post on the best used cars to stock in 2026 covers the segments and price points that turn fastest.
If you specialize in trucks, sourcing strategy matters even more. See our guide to sourcing used trucks for independent dealers for auction tactics and trade-in best practices.
Price it to move from day one. Shoppers compare prices across every lot in reach before they call, so you need to price used cars with a dealer markup strategy that assumes rational, data-driven buyers, not impulse shoppers. If your price is well above market on day zero, you'll mark it down to market by day 30 anyway; you just lost a month of your profit window.
Control recon time and cost. A unit that sits in the shop for two weeks waiting for detailing and a headlight has used up half of its first 30 days before it hits the lot. Track used car reconditioning cost and budget the same way you track days to sell. The faster you turn recon, the more of your profit window you keep.
Tracking age and triggering action in your DMS
You can't manage what you don't measure. The dealers who avoid the penalty zone look at inventory age every day and have set triggers that force action before a unit hits 30 days.
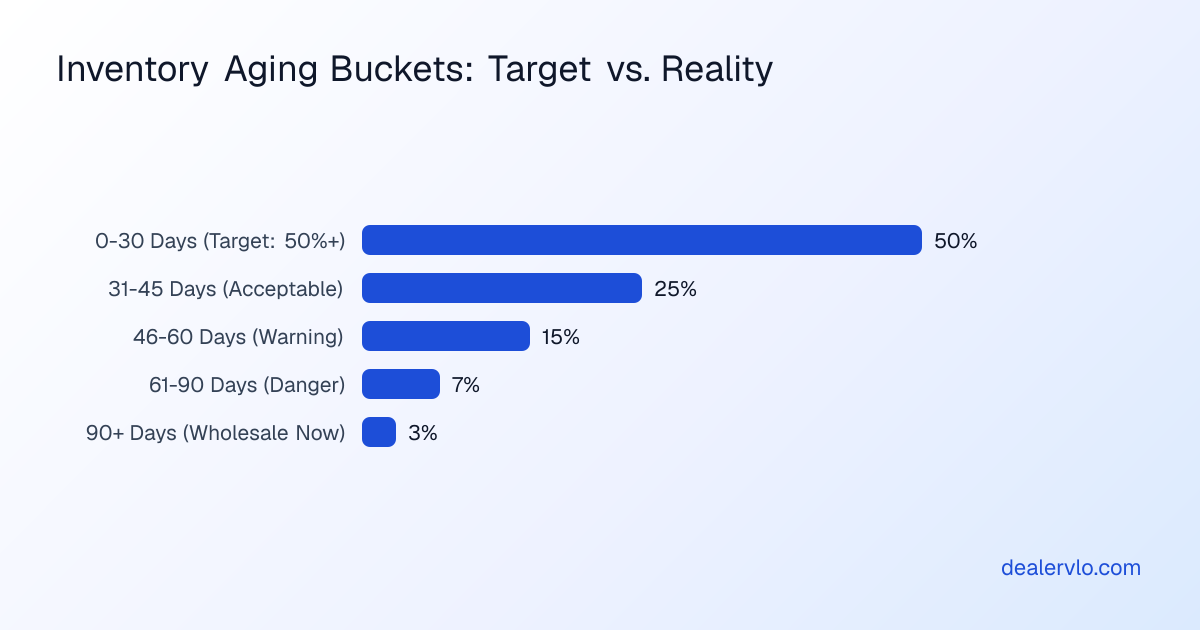
Your DMS should show you days in stock, aging buckets, and all-in cost per unit (purchase plus reconditioning). If it doesn't, you're flying blind. At day 15, review price and engagement. At day 30, reprice or promote. At day 45, reprice hard or wholesale. At day 60, move it: auction, an aged-inventory buyer, or take the loss. The dealers who wait until day 90 to act have already lost the gross.
If you're evaluating systems, our guide to the best DMS for independent used car dealers and the post on cloud-based DMS for used car dealers cover what to look for and why age tracking matters.
In DealerVLO, every car shows its days in inventory next to its all-in cost (with reconditioning tracked line by line) and margin. Cars at 60+ days get an "aging, consider repricing" flag, the dashboard counts your 60+ day units, and the inventory aging report buckets stock into 0-30, 31-60, 61-90 and 90+ days. The AI price suggestion gives a price range from live comparable listings plus a target price for selling in about 30 days. DealerVLO doesn't mark prices down for you or calculate floor plan interest per car; the repricing call is yours, and the holding cost calculator turns days on lot into dollars.
Exit strategies when a unit ages past 60 days
Even with tight controls, some units age. Maybe the market shifted, maybe you misjudged demand, maybe the buyer who wanted it bought elsewhere. When a car crosses 60 days, you need an exit plan that stops the bleeding.
Wholesale at auction is the cleanest exit. You lose some gross, but you recover capital and stop interest, fees and overhead from compounding. Book the unit conservatively, send it to the lane, and move on. Every month you wait adds another month of costs and another month of market slide.
Sell to an aged-inventory buyer. Some operators specialize in buying aged inventory in bulk at a discount for their own channels. The price is usually worse than auction, but it's fast and it clears the lot. If you have several aged units tying up capital, one buyer can move all of them in one transaction.
A real markdown and a push. If you're confident the unit is solid and the market just missed it, take a meaningful price cut, not a token $200, and push it hard on social, your website, and any local buyer groups. You're trading margin for speed, but speed is what saves you from the next curtailment.
The key is having the exit strategy ready before you need it. Dealers who wait until the lender calls to curtail have already lost control of the decision.
Frequently asked questions
What are the main components of used car holding costs?
Four costs run at once: floor plan interest and fees (quoted per dealer; providers don't publish standard rates), depreciation (the market value of the car slipping while it sits, which you give back in markdowns), lot space, insurance and overhead allocated to each car, and opportunity cost (the working capital tied up in aged units that could be buying fresh inventory). On a car that ages past 60 days, depreciation and opportunity cost often outweigh the interest.
How much does it cost per day to hold a used car on a floor plan?
Work it out per car rather than borrowing someone's average. Interest is the amount financed times your APR divided by 365: a $32,000 SUV at an example 9% is about $7.89 a day, and with an example $45 monthly fee that's about $282 over 30 days and $845 over 90. Then add how fast that car's market value is slipping, plus the lot, insurance and overhead you allocate per car. The holding cost calculator adds those up for you.
At what point does holding cost erase front-end gross profit?
It depends on the car's price, your rate and fees, and how fast its segment is losing value. In the worked example in this post, a planned $3,000 gross is down to about $495 by day 90 once interest, fees, the market's slide, an extra markdown, and allocated overhead are counted. Run your own numbers per car; the earlier you see the slide, the more choices you have.
What inventory turn rate should I target to avoid aged inventory?
Set it from your own sales history rather than a national benchmark: measure your average days to sale by type of car, then aim to beat it. A practical routine is a price review at day 15, a decision (reprice or promote) at day 30, and a hard look at wholesaling anything still unsold around day 60. The inventory turn rate guide covers how to measure it.
When should I wholesale a car instead of holding it for retail?
Set a wholesale deadline before you need it. If a unit reaches about 60 days without serious buyer interest despite repricing and promotion, the math usually favors wholesaling it to recover capital and stop interest, fees and market slide from compounding. Every extra month adds roughly another month of all three, and a curtailment may come due, so the loss you take earlier is usually smaller than the one you take later.
How do I calculate total holding cost for a specific vehicle?
Start with daily floor plan interest: amount financed times your annual rate, divided by 365. Add any monthly fees your lender charges, prorated per day. Estimate how fast the car's market value is slipping from recent comparable listings or your own sales, and add the lot, insurance and overhead you allocate per car. Multiply the daily total by days in stock, add any markdowns you've taken, and subtract from your original projected gross. The free holding cost calculator does this for you.
The bottom line
Used car holding costs are a daily tax on gross profit that never stops accumulating. With interest, fees, overhead and market slide all running every day, the penalty zone starts around day 30 and gets expensive by 60. The difference between a $3,000 winner and a $500 break-even isn't luck; it's turn rate, pricing discipline, and the willingness to act before the lender forces your hand.
Track days in stock, put your markdown triggers on the calendar, and wholesale anything that crosses 60 days without serious traction. The gross you save is the gross you keep.
14-day free trial, then $29/mo · Cancel anytime
Estimate your daily floor-plan carrying cost per unit.
Open the Floor Plan Calculator