How to Calculate Your Ideal Inventory Count: Turn Rate & Days Supply Formula
The formula for your ideal inventory level from monthly sales and target turn. Stop overstocking: 50 cars/month at a 40-day turn is 67 units, not 100.
Part of the Inventory, pricing & aging guide: Inventory Turn Rate for Used Car Dealers: Benchmarks, Formula & How to Improve
Switching from another DMS? Compare DealerVLO to DealerCenter, Frazer, or Lot Wizard.
The most expensive mistake in independent used-car dealership operations isn't buying the wrong car — it's buying too many of them. If you're selling 50 cars a month and carrying 100 units on the ground, you're not giving customers more selection. You're burning cash on floorplan interest and depreciation at a rate that will cost you more than poor per-unit gross ever could.
The ideal inventory level for a used car dealer is the minimum number of units needed to sustain your current sales velocity at your target turn rate. It's a simple formula, but most dealers never calculate it. They stock based on gut feel, available capital, or what the lot can physically hold — and the result is overstocking that quietly drains six figures a year in carrying costs.
Here's the reality: if you sell 50 cars a month and want a 40-day turn rate, your ideal inventory is 67 units, not 100. The math is straightforward, the financial impact is massive, and this is how you calculate it.
Note: This article covers operational benchmarks and financial calculations, not compliance requirements. Verify floorplan terms and local inventory tax rules with your lender and accountant.
14-day free trial, then $29/mo · Cancel anytime
The core formula: Days supply equals units you need
The foundational calculation for inventory planning is days supply, which tells you how many days it would take to deplete your current inventory at your current sales rate.
Days Supply = Current Inventory Units ÷ Average Daily Sales Rate
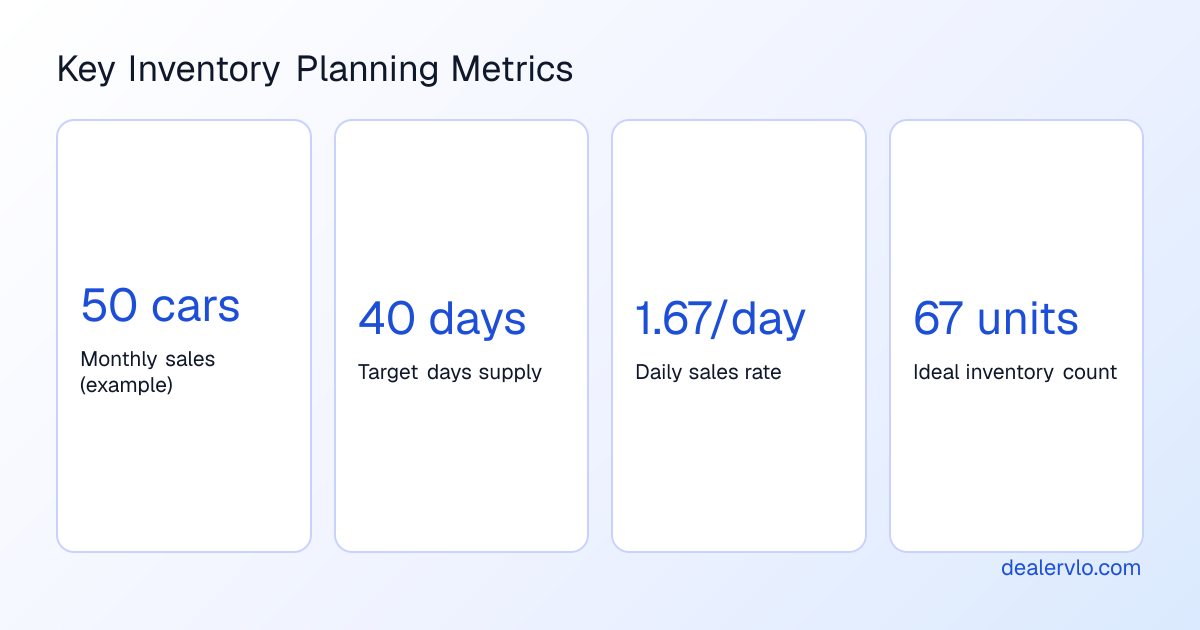
You calculate your daily sales rate by dividing last month's retail unit count by 30. If you sold 50 cars last month, your daily rate is 1.67 units. If you have 100 units on the ground, your days supply is 100 ÷ 1.67 = roughly 60 days.
Now reverse the formula to find your ideal inventory count:
Ideal Inventory = Target Days Supply × Daily Sales Rate
If you want a 40-day turn and you're selling 1.67 units per day, you need 40 × 1.67 = 67 units on the lot. Anything above that extends your turn, increases carrying costs, and doesn't materially improve selection for your customer base.
The disconnect happens because dealers think inventory is an asset. It is — on paper. But every day a car sits on your lot, it costs you money in floorplan interest, depreciation, opportunity cost, and the chance that the market moves against you. Inventory is a tool, not a trophy. You want just enough to match your sales velocity, and not one unit more.
Industry benchmarks: What turn rate should you target?
The gold standard is 12 turns per year, which means you turn your entire inventory every 30 days. At that pace, your inventory count on the ground equals your monthly retail volume — if you sell 50 cars a month, you stock 50 units.
However, the average dealer in the U.S. turns inventory every 63 days, which is less than half the benchmark. Most independent dealers fall somewhere between those extremes. Industry consensus puts a healthy turn rate for used-car dealers between 12 and 15 turns annually, or roughly one to 1.25 turns per month.
For independent dealers specifically, current market conditions show an 82-day supply as a recent snapshot, though market supply has stabilized in the 40–45 day range for used vehicles in 2026. Your target depends on your market, your inventory mix, and your capital structure — but if you're turning slower than 45 days, you're carrying too much.
Category matters. Trucks might run a 45-day turn at higher gross. Compact cars move faster — think 35-day turn at lower gross. Luxury vehicles sit longer, perhaps 55 days, but command stronger margins. The principle is the same: set a realistic turn target for each segment, then calculate the unit count that supports it based on your actual sales rate in that category.
Here's the critical insight: turn rate multiplies your effectiveness. A dealer turning inventory every 30 days generates dramatically more gross profit per year from the same capital base than a dealer turning every 60 days, even if per-unit gross is identical. If you stock 100 units and turn them 12 times a year at $2,500 average gross, you generate $3 million in total gross. Turn them six times a year at the same per-unit gross, and you generate $1.5 million. Same inventory investment, half the annual gross.
You can explore these dynamics in detail in our guide to inventory turn rate for used car dealers, which breaks down how turn compounds profit.
Calculating your number: Work through the formula step by step
Let's walk through the calculation with real examples so you can apply it to your own operation.
Example 1: The 40-day turn dealer (recommended baseline)
- Monthly sales: 50 cars
- Daily sales rate: 50 ÷ 30 = 1.67 cars/day
- Target days supply: 40 days
- Ideal inventory: 40 × 1.67 = 67 units
This is a realistic, healthy baseline for an independent dealer. You're turning faster than the industry average, you're not over-leveraged, and you have enough selection to serve walk-in traffic without carrying excess aging inventory.
Example 2: The gold-standard 30-day turn
- Monthly sales: 50 cars
- Daily sales rate: 50 ÷ 30 = 1.67 cars/day
- Target days supply: 30 days
- Ideal inventory: 30 × 1.67 = 50 units
At a true 30-day turn, your lot count equals your monthly retail volume. This is aggressive, requires excellent sourcing and pricing discipline, and rewards you with minimal carrying costs and maximum cash velocity. It's achievable if you have strong buyer traffic, a focused inventory strategy, and the operational systems to move cars fast. Tools like our floor plan calculator can help you model the capital requirements and interest costs at different inventory levels.
Example 3: The over-stocked problem
- Monthly sales: 50 cars
- Actual inventory: 100 units
- Actual days supply: 100 ÷ 1.67 = 60 days
This is the single most common problem we see. You're selling 50 cars a month, but you've convinced yourself that 100 units gives you better selection, better trade-in appeal, or just looks more impressive. The data doesn't support it. Beyond a certain threshold, additional inventory doesn't increase sales — it just increases carrying costs and average age.
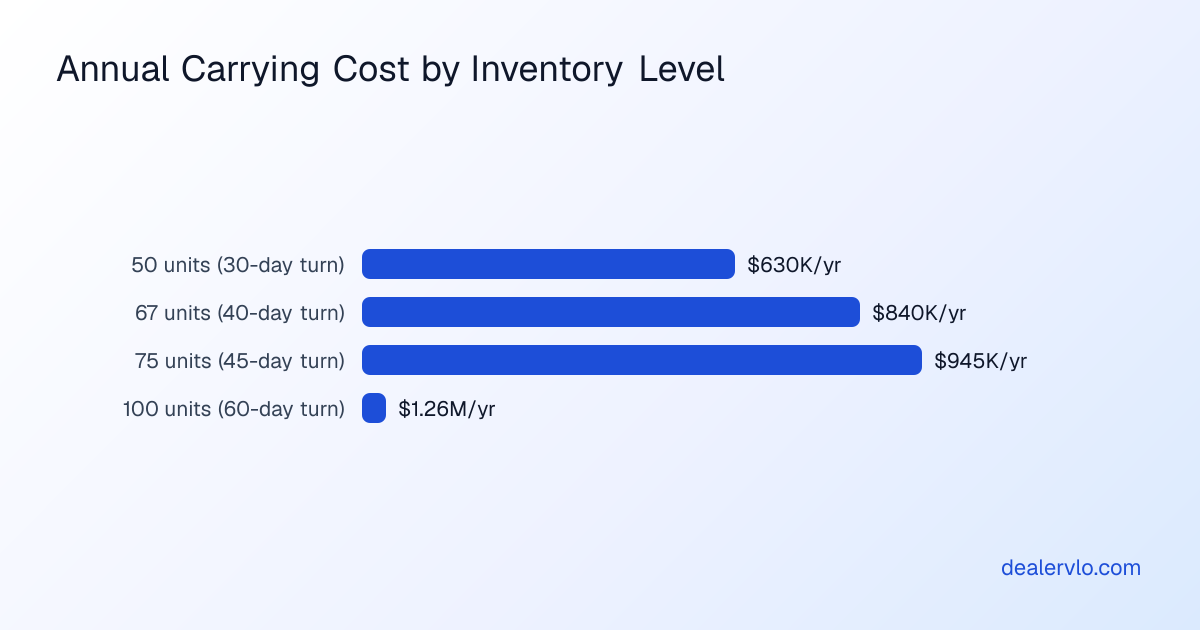
At a conservative estimate of $35 per unit per day in total holding costs (floorplan interest, depreciation, insurance, opportunity cost), 100 units costs you $3,500 per day, or $105,000 per month. Compare that to 67 units at the same rate: $2,345 per day, or roughly $70,000 per month. The difference — $35,000 per month, or $420,000 per year — is pure waste. You're not selling more cars. You're just financing more metal.
If you're stocking based on available credit rather than sales velocity, you're doing it backward. The lender will let you borrow up to your limit — that doesn't mean you should. For pricing strategies that help you turn inventory faster without sacrificing margin, see our guide on how to price used cars and set dealer markup.
The real cost of carrying inventory in 2026
Holding costs have increased sharply over the past few years, driven by higher floorplan interest rates and tighter margins. Understanding the total cost per unit per day is critical to making informed stocking decisions.
Floorplan interest
Most floorplan lines are now priced in the range of a base rate plus 200 to 400 basis points, depending on your credit profile. Recent dealer filings show weighted average floorplan rates in the range of 4.4% to 5.0%. Dealer financial data from Optimum Info put floorplan expense at $427 per unit in Q3 2025, up 13.2%, and its Q1 2026 report found new-vehicle days' supply up 24.4% to 105 days with floorplan costs still rising.
As a practical estimate, floorplan interest runs $150 to $300 per vehicle per month depending on the vehicle's value and your rate. On a $20,000 car at 5% annual interest, you're paying roughly $83 per month, or about $2.75 per day, in interest alone. On higher-value inventory or at higher rates, that figure climbs quickly. Over 12 months on a 100-vehicle lot, you might pay $30,000 to $50,000 in floorplan interest — and that's just one component of total carrying cost.
Depreciation
Most used vehicles depreciate $100 to $200 per month, though the rate varies by segment and seasonality. Trucks and SUVs can depreciate faster during certain months, particularly if you're holding summer inventory into fall. Compact cars and sedans tend to depreciate more steadily.
As a baseline, a typical used vehicle loses roughly 44% of its value over the first five years, with the steepest drop occurring early. Once a car is on your lot, you're fighting time. Every extra week you hold it, the wholesale floor drops, and the retail price you can command softens. The longer the car sits, the more you have to discount to move it — which erodes the margin you were counting on when you bought it.
Total daily holding cost
When you combine floorplan interest, depreciation, insurance, lot overhead, and opportunity cost, most dealers now report total holding costs in the range of $30 to $40 per unit per day. That's a useful rule of thumb for planning. For every car on your lot, you're burning $900 to $1,200 per month until it retails.
This is why days supply matters so much. The difference between a 40-day turn and a 60-day turn isn't just 20 days — it's 20 days × $35/day = $700 per unit in additional carrying cost. Across 100 units turning at 60 days instead of 40, that's $70,000 in extra cost that contributes nothing to gross profit.
Why more inventory doesn't mean more sales
The instinct to carry more inventory is understandable. You want to give customers choice. You want to capture every possible sale. You don't want to lose a deal because you didn't have the right car.
But beyond a certain point — usually somewhere around 45 to 60 days of supply for a typical independent dealer — additional inventory stops driving incremental sales. What happens instead is that your average age creeps up, your carrying costs climb, and you start discounting aged units to move them, which drags down your overall gross.
The most common mistake dealers make is carrying too much inventory relative to sales velocity. They convince themselves that more selection drives more sales, but the operational data doesn't support it. A dealer with 67 well-chosen units turning every 40 days will outsell and out-earn a dealer with 100 poorly aging units turning every 60 days, even if both have the same showroom traffic.
Turn rate is a force multiplier. With 100 units on the lot, a dealer turning every 30 days can generate $2.5 million in annual gross profit, while a dealer turning every 60 days generates $1.5 million — a million-dollar差 difference from the same inventory investment and the same per-vehicle gross.
Your edge isn't in having more cars. It's in having the right cars, priced correctly, and moving them before they age. For help identifying which vehicles to stock based on current demand and margin potential, see our 2026 guide to the best used cars to stock.
Segment-specific turn targets and category management
Not all inventory should turn at the same rate. A formal category-management approach means setting distinct turn and gross targets for each segment you stock, then managing inventory levels and aging thresholds by category.
Here's a realistic framework for segment-specific targets:
- Trucks: 45-day turn, $3,500 gross
- Compact cars: 35-day turn, $2,200 gross
- Luxury vehicles: 55-day turn, $4,200 gross
The principle is straightforward: faster-turning, lower-margin inventory (compacts, sedans) needs to move quickly to justify the slot on your lot. Higher-margin inventory (trucks, luxury) can sit a bit longer because the gross profit per unit offsets the carrying cost — but only up to a point. A luxury car that sits 90 days has eaten up most of its margin advantage in holding costs and depreciation.
Track days supply and turn rate by category, not just lot-wide. If your trucks are turning every 35 days but your sedans are sitting 70 days, you're over-stocked in sedans and probably under-stocked in trucks. Adjust your buying accordingly.
This also helps you make smarter trade-in decisions. If a customer offers you a vehicle in a category that's already turning slowly, you need to either price it aggressively or walk away — taking on more slow-moving inventory just because you have the credit line is a losing strategy.
Get your annual turn rate and days' supply — and see what the same inventory could make at a faster turn.
Open the Inventory Turn CalculatorAdjusting for market conditions and your capital structure
Your ideal inventory count isn't static. It should shift based on market conditions, seasonality, your cost of capital, and your current cash position.
If interest rates are high and floorplan costs are elevated — as they are in 2026 — every day of extra inventory is more expensive than it was in prior years. Higher rates and slower turn have driven net floorplan expense per unit up sharply, which means every extra day a car sits costs more than it did a year ago. In that environment, you should bias toward a tighter inventory count and a faster turn.
If you're well-capitalized, have access to cheap floorplan money, and operate in a market with strong, consistent traffic, you can afford to run a slightly higher days supply — say 50 to 55 days — without taking excessive risk. But if you're capital-constrained, paying high floorplan rates, or operating in a softer market, you need to run lean. A 35- to 40-day turn is not just prudent; it's survival.
Seasonality also matters. If you're heading into your strong season and you know traffic will pick up, you can justify stocking ahead slightly — but base that decision on historical sales data, not optimism. If you typically sell 60 cars in May and 50 in June, you can carry 70 units in April. But if you stock 90 units in April based on hope, you'll spend May discounting aged inventory instead of capturing margin.
For broader operational benchmarks to help you assess whether your inventory strategy aligns with healthy dealership financials, see our used car dealer benchmarks guide.
14-day free trial, then $29/mo · Cancel anytime
Managing aged inventory: The 45-day and 60-day thresholds
Even with a disciplined stocking strategy, some units will age past your target. The key is having clear thresholds and action triggers so aged inventory doesn't quietly accumulate and drag down your turn rate.
Industry practice treats 45 days as the first action threshold. Used vehicles should generally be sold within 45 days to control depreciation and holding costs. Once a car crosses 45 days, it's time to re-price, boost it in your marketing, or consider wholesaling if retail interest isn't materializing.
At 60 days, a unit enters the must-sell zone. Used vehicles over 60 days are costing you more in carrying costs than they're likely to return in incremental gross. Don't wait for the perfect retail buyer — at this point, getting your capital back and redeploying it into fresh inventory is more profitable than holding out for another $500 in gross.
Set a hard policy: any car that hits 60 days gets wholesaled or auctioned that week unless there's a compelling reason to hold it (a confirmed buyer, a seasonal vehicle approaching peak demand, etc.). Aged inventory is a cancer. It ties up capital, increases your average days supply, and creates pressure to discount across the board just to generate cash flow.
You should also track aging by category. If your trucks are all moving in 40 days but you have sedans sitting 80 days, you have a category problem, not just a few bad buys. Adjust your acquisition strategy and stop stocking the slow-moving segment until market conditions or your pricing changes.
How to implement this calculation at your dealership
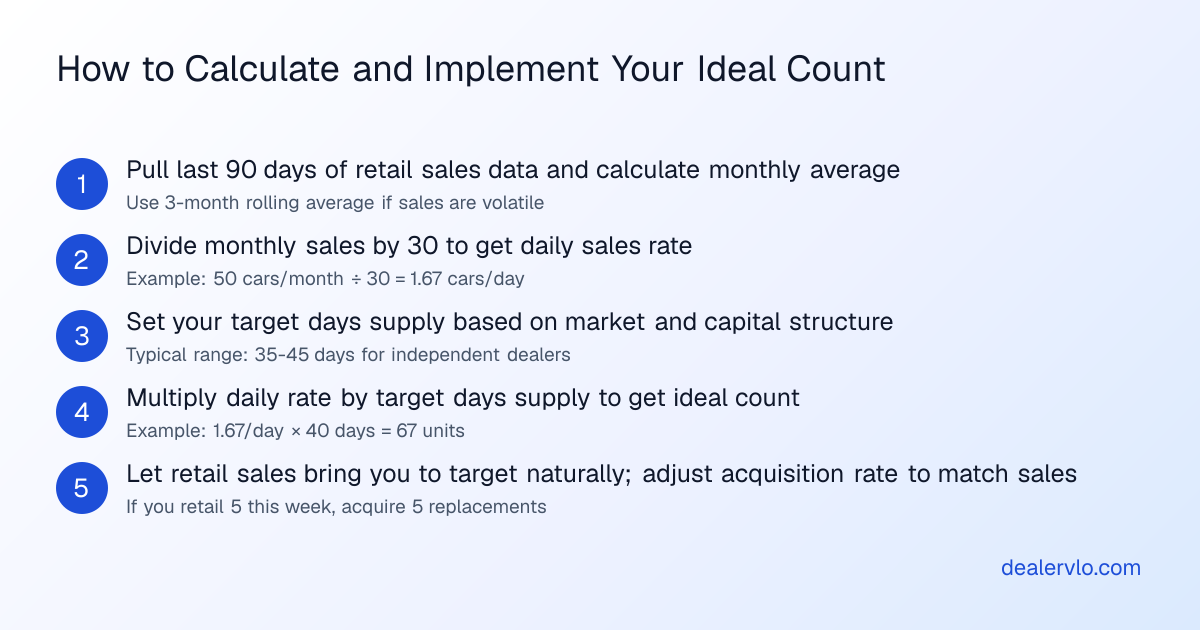
Start by pulling your last 90 days of retail sales data. Calculate your average monthly unit sales — if it's volatile, use a three-month rolling average rather than a single month to smooth out anomalies.
Divide that monthly average by 30 to get your daily sales rate. Then decide on your target days supply. If you're currently over-stocked and need to tighten up, start with a 40-day target. If you're already running lean and want to optimize further, aim for 35 or even 30 days.
Multiply your daily sales rate by your target days supply. That's your ideal inventory count. Compare it to your current lot count. If you're significantly over, stop buying for a few weeks and let retail sales bring your inventory down naturally. Don't dump inventory at auction just to hit a target — that destroys value. Instead, let attrition and normal retail sales bring you into balance while you adjust your acquisition rate downward.
Once you're at your target count, manage to it actively. If you retail five cars this week, you can acquire five replacements. If you retail three, acquire three. This discipline keeps your inventory count stable, your days supply consistent, and your carrying costs predictable.
Track your turn rate monthly. Calculate it as 365 days ÷ average vehicle inventory age, or alternatively as total vehicles sold ÷ average inventory count. If your turn rate is slipping, you're either over-buying, under-pricing, or stocking the wrong mix. Diagnose the problem and correct it before it compounds.
For more on the mechanics and financial impact of inventory turn, including how to measure and improve it, see our detailed breakdown of inventory turn rate for used car dealers.
Common mistakes and how to avoid them
Stocking to your credit limit instead of your sales velocity. Just because your floorplan lender approves you for $2 million doesn't mean you should borrow it all. Stock to your turn rate, not your borrowing capacity.
Ignoring category-level turn rates. Lot-wide averages hide problems. You might have a 45-day overall turn, but if half your inventory is turning in 30 days and the other half is sitting 60, you're over-stocked in the slow categories.
Buying based on availability instead of demand. Auctions and wholesale sources will always have inventory available. That doesn't mean you should buy it. If a car doesn't fit your current sales mix and target turn rate, pass — even if it's a great buy on paper.
Treating inventory as an asset instead of a tool. Yes, inventory appears on your balance sheet as an asset. But it's a depreciating, expensive asset that costs you money every day you own it. Think of it as a cost center that you need to cycle through as quickly as possible, not a trophy collection.
Holding aged units hoping for a better retail buyer. Once a car hits 60 days, the math is against you. Wholesale it, take your lumps, and redeploy the capital into fresh inventory that will turn. Holding out for another $500 in gross while you pay $35/day in carrying costs is a bad trade.
For insight into how presentation and reconditioning speed can help you turn inventory faster and command stronger retail prices, check out our guides on how to detail and recondition cars for resale and how to photograph used cars.
Market days supply: A broader benchmark to watch
In addition to tracking your own days supply, it's useful to monitor market days supply (MDS) — the average days of inventory available across your market or segment. This helps you understand whether your turn rate is competitive and whether wholesale values are likely to rise or fall.
A commonly cited target for average market days supply is around 70 days, though that varies by vehicle type and regional market conditions. When market supply tightens below that level, wholesale values tend to firm up or rise, and you have more pricing power at retail. When supply expands well beyond 70 days, wholesale values soften, and you need to turn faster to avoid getting caught in depreciation.
In early 2026, used-car supply has stabilized in the 40–45 day range, which is healthy and supports reasonable pricing. New-vehicle supply, by comparison, has rebounded into the 70–90 day range across many segments. If you're an independent used-car dealer, these macro supply levels affect your acquisition costs, your trade-in values, and the competitive landscape for retail pricing.
Pay attention to these trends, but don't let them override your own operational math. If market supply is tight and you're tempted to stock up, remember that your ideal inventory count is still dictated by your sales velocity and target turn rate — not by market availability.
Cash flow and opportunity cost: The hidden benefit of running lean
The financial benefit of right-sizing your inventory goes beyond saving on floorplan interest and depreciation. Running a leaner inventory count improves your cash flow, increases your return on capital, and gives you flexibility to respond to market shifts.
If you're carrying 67 units instead of 100, you've freed up roughly $500,000 to $650,000 in capital (assuming an average cost of $15,000 to $20,000 per unit). That capital can sit in your operating account as a cash cushion, fund reconditioning and marketing, or let you jump on exceptional buying opportunities when they arise.
Dealers who run tight inventories and turn fast also have an easier time managing floorplan covenants, maintaining strong lender relationships, and weathering market downturns. If the market softens and your turn rate slows from 40 days to 50 days, you can adjust quickly by pausing acquisitions for a week or two. If you're already over-stocked at 100 units and your turn slows, you're in trouble — you can't stop buying without creating gaps in your selection, and you can't keep buying without bleeding cash.
Lean inventory is strategic flexibility. It lets you adapt, pivot, and capitalize on opportunities without the anchor of aging, over-leveraged metal dragging you down.
For guidance on allocating capital efficiently across inventory, marketing, and operations, see our article on used car dealer marketing budgets.
Frequently asked questions
What is the ideal inventory level for a used car dealer?
The ideal inventory level is the minimum number of units needed to sustain your monthly sales at your target turn rate. Calculate it by multiplying your daily sales rate (monthly sales ÷ 30) by your target days supply. For example, if you sell 50 cars per month and target a 40-day turn, your ideal inventory is 67 units. This keeps carrying costs manageable while maintaining sufficient selection for your customer base.
How do I calculate my dealership's inventory turn rate?
You can calculate turn rate two ways. First method: divide 365 days by your average vehicle inventory age. Second method: divide total vehicles sold in a period by your average inventory count during that period. For example, if you sold 90 cars in a month with an average inventory of 30 units, your turn rate is 3.0 for that month, or 36 annualized. Track this monthly to catch trends before they become problems.
What is a good turn rate for an independent used car dealer?
Industry benchmarks suggest 12 to 15 turns per year, which translates to turning your inventory every 24 to 30 days. The gold standard is 12 turns annually — a 30-day turn. However, the average U.S. dealer turns inventory every 63 days. A realistic, healthy target for most independent dealers is 40 to 45 days of supply, which gives you reasonable selection without excessive carrying costs. Anything slower than 60 days means you're over-stocked.
How much does it cost to hold a used car in inventory per day?
Most dealers now report total holding costs of $30 to $40 per unit per day when you include floorplan interest, depreciation, insurance, and opportunity cost. Floorplan interest alone runs $150 to $300 per vehicle per month depending on the car's value and your rate. Depreciation adds another $100 to $200 per month. The longer a car sits, the more these costs compound, which is why fast turn is critical to profitability.
At what point should I wholesale an aged unit instead of holding it for retail?
Used vehicles over 60 days enter a must-sell zone where carrying costs erode most of the remaining margin. Industry practice suggests selling within 45 days to control depreciation. Once a car crosses 60 days, wholesale it or send it to auction unless you have a confirmed retail buyer or a compelling seasonal reason to hold it. The capital you recover and redeploy into fresh, fast-turning inventory will earn more than the extra gross you might capture by waiting.
Should I stock more inventory if I have available credit on my floor plan?
No. Stock to your sales velocity and target turn rate, not to your borrowing capacity. Just because your lender approves you for a certain credit limit doesn't mean using it all is profitable. Over-stocking increases carrying costs, slows your turn rate, and ties up capital in depreciating assets. The goal is to match inventory count to sales rate so you turn fast and minimize holding costs, not to maximize the amount of metal on your lot.
Bottom line
The ideal inventory count for your dealership is not a guess, a credit limit, or what fits on your lot. It's a calculated number based on your actual monthly sales and your target turn rate. If you're selling 50 cars a month and you want a healthy 40-day turn, you need 67 units on the ground — not 100.
Overstocking is the single largest silent cash drain in most independent used-car operations. Every unit beyond your ideal count costs you $30 to $40 per day in floorplan interest, depreciation, and opportunity cost, and it contributes nothing to sales volume. Run the formula, compare it to your current lot count, and adjust. The difference between running tight at 67 units and running fat at 100 can easily be $400,000 a year in unnecessary carrying costs.
Turn rate multiplies everything. Stock the right count, turn it fast, and you'll generate more gross profit from less capital than you ever did with a bloated inventory and slow turn. The math doesn't lie, and the dealers who run lean consistently outperform the ones who stock heavy.
14-day free trial, then $29/mo · Cancel anytime
Estimate your daily floor-plan carrying cost per unit.
Open the Floor Plan Calculator