Used Car Dealer Benchmarks: how your lot compares
The operating numbers dealers pay 20 Groups thousands to see — days supply, turn, cost-to-market, gross, recon — collected in one place, every figure sourced, with a free way to check your own lot against them. Written by a dealer who runs one.
The most valuable thing a dealer buys from a NIADA or NADA 20 Group isn’t the meetings — it’s the composite data: a way to see whether your gross, your turn, and your expense ratios are normal, good, or quietly bleeding you. That comparison is worth real money, which is why it usually costs it.
Below are the benchmarks that matter most for a small independent lot, pulled from public industry sources and marked so you can see exactly where each number comes from. Treat them as directional — every lot’s mix and market is different — but they are the right yardstick to hold your own numbers against.
Inventory & turn
For a small lot, cash flow lives here. A car that doesn't move isn't just unsold — it's money you can't use to buy the next one.
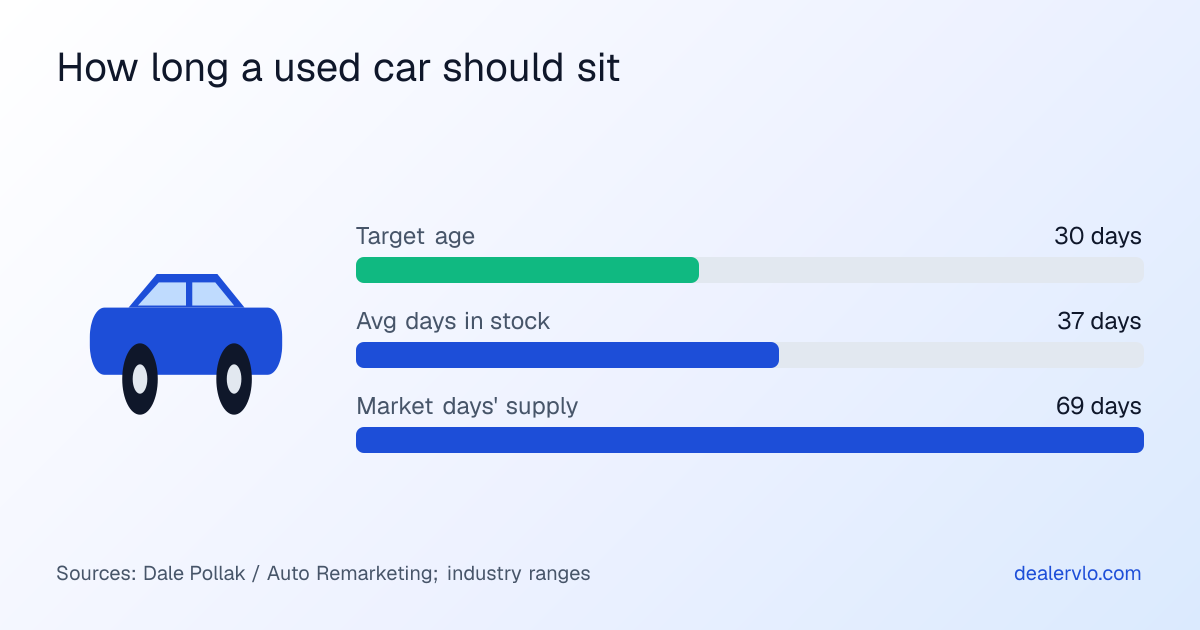
How long your current inventory would last at your current sales pace. Lower is tighter money; much above ~70 and cash is sitting still.
Average age of a car on the lot when it sells. The same analysis suggests aiming for 55% of your inventory under 30 days old.
How many times you sell through your entire lot in a year. Roughly one turn every 28 days. Turn speed beats margin for a small lot's cash flow.
Average money in each car across the 60 dealers analyzed. Higher on a truck/SUV-heavy lot, lower on a sub-$15k budget lot.
Pricing & acquisition
Front-end gross is won when you buy, not when you sell. These two ratios are where dealers quietly give it away.
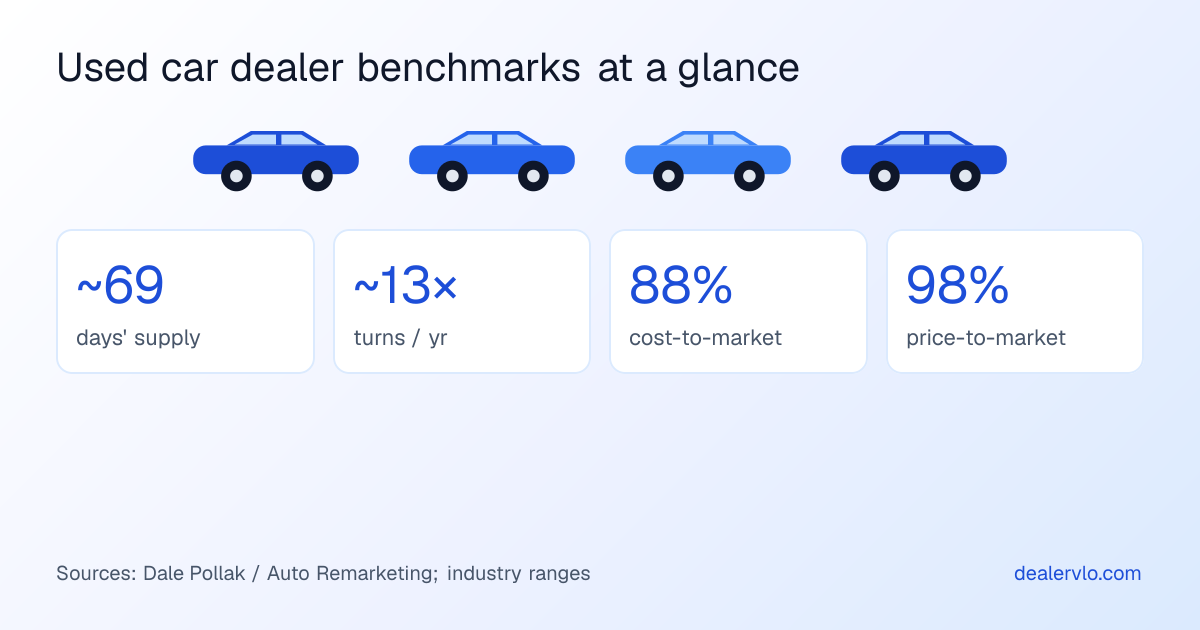
What you paid for a car as a percent of what the market says it's worth. 88% leaves a 12% front-end spread; buying at 85% widens it. This is bought at acquisition, not made at sale.
Your asking price as a percent of the market average for that vehicle. Pricing above ~100% is the fastest way to grow an aged tail.
Gross & reconditioning
What you actually keep per car — and the biggest controllable cost between the auction and the sale.
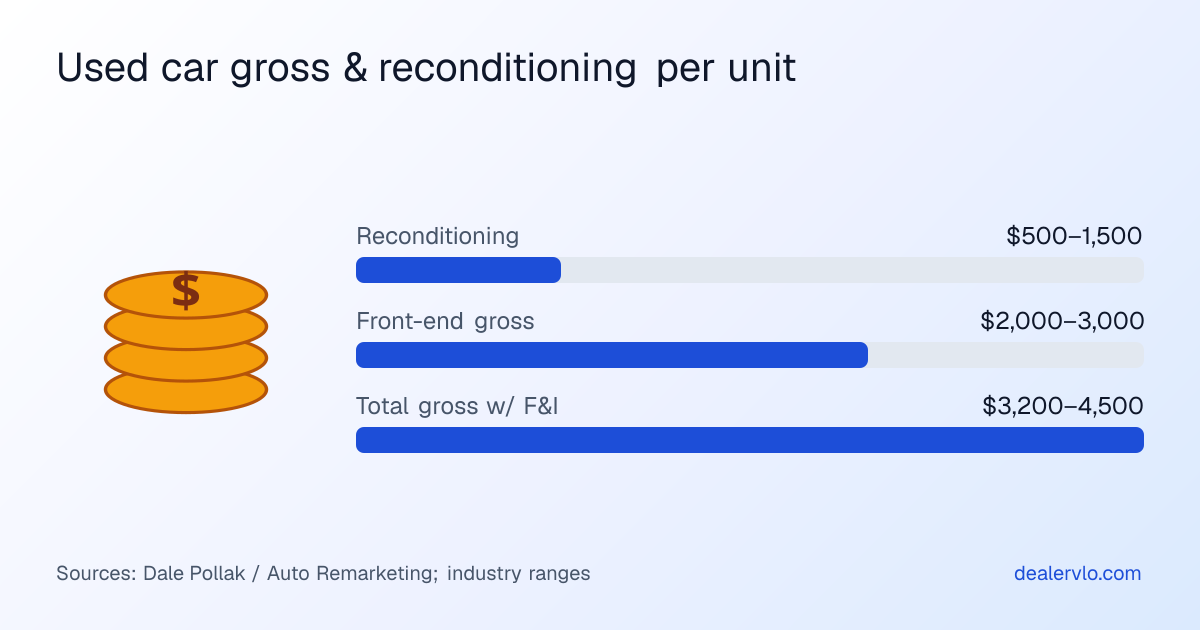
Sale price minus what's in the car (acquisition + recon), before F&I. Widely reported healthy range; top operators run higher, thin-margin/high-volume lots lower.
Front-end plus back-end (warranty, GAP, finance reserve). The franchised-dealer band; independents without an F&I product run below it.
Typical spend to get a used car retail-ready — mechanical, detail, tires. Heavier on older/higher-mileage inventory. Comes straight out of front-end gross.
What these numbers feel like on a real lot
I run an independent lot in Massachusetts, so let me translate the averages. A 69-day supply and 37-day average sound comfortable until you carry a handful of units past 90 — then the average is a lie, because those slow movers are eating the gross your fast ones make. The benchmark that actually changed how I buy wasn’t turn, it was cost-to-market: once you accept you can’t price your way out of overpaying, you get disciplined in the lane, and everything downstream gets easier.
The other thing the averages hide: on a small lot, turn beats margin almost every time. A $2,000-gross car that sells in three weeks funds more inventory than a $3,500-gross car that sits for three months and quietly bleeds carrying cost the whole time. That’s the whole reason the age-mix number at the top of this page matters more than any single deal.
Check your own lot against these
Free, no signup. Both take under a minute.
Sources
The cited figures trace to these. Ranges labeled “widely-reported” are directional rules of thumb, not a single study — a benchmark page that pretends otherwise isn’t worth trusting.
- Dale Pollak — “6 benchmarks top used-vehicle dealers achieve,” Auto Remarketing Days supply, days-in-inventory, turns, cost-to-market, price-to-market, average inventory cost — from a 60-dealer analysis.
- NIADA Used Car Industry Report (UCIR) Independent used-vehicle sales volume and state-level dealer data. Full operating benchmarks are in the paid dealer report.
- NADA — dealership financial data Franchised-dealer average used-vehicle gross, tracked annually.
Common questions
What is a good gross profit per used car for an independent dealer?
A commonly-cited healthy front-end gross is $2,000 to $3,000 per unit — the sale price minus what's in the car (acquisition plus reconditioning), before any F&I products. Including back-end gross from warranties and finance, franchised stores average roughly $3,200 to $4,500 total per used car; independents without a strong F&I product typically run lower. These are directional ranges — your real number depends on your inventory mix, market, and how fast you turn.
How many days should a used car sit before it's a problem?
Industry analysis puts average days in inventory around 37 days, with a common goal of keeping 55% of your lot under 30 days old and overall market days' supply near 69 days. Most independent dealers treat a unit as aged past 60 days and a problem past 90, because beyond that the carrying cost and depreciation usually outrun any gross a longer hold recovers.
What is cost-to-market and why does it matter?
Cost-to-market is what you paid for a vehicle as a percentage of its current market value. Top dealer groups run around 88%, though ~85% is the more commonly recommended target — and the difference is your front-end gross. The key point: that spread is won at acquisition, in the lane or on the trade, not at the sales desk. You cannot price your way out of paying too much for a car.
How do I compare my own lot to these benchmarks?
Start with the two numbers that drive the rest: your inventory age mix and your gross per unit. The free Lot Health Grader grades your age distribution against the turn benchmarks above, and the Profit Margin Calculator shows your real front-end gross after recon and holding cost. Both take under a minute and need no signup.
Stop guessing at your numbers
DealerVLO tracks days-in-stock, gross, and your aged tail on live inventory — the same benchmarks above, running on your actual lot instead of a rough count. $29/month, flat.
Start a free trial