Inventory Turn Rate for Used Car Dealers: Benchmarks, Formula & How to Improve
The inventory turn rate formula, benchmarks for used car dealers (12 turns a year vs. reality), what slows turnover, and how to move inventory faster.
Switching from another DMS? Compare DealerVLO to DealerCenter, Frazer, or Lot Wizard.
What Inventory Turn Rate Tells You
Your inventory turn rate — the number of times you sell through your entire stock in a year — might be the single most important number in your used car operation. It captures how efficiently you're converting capital into sales, how well you're reading your market, and whether your inventory strategy is making you money or quietly bleeding it away.
The math is straightforward. If you're turning inventory twelve times a year, you're cycling through stock every thirty days. If you're turning six times, you're holding units an average of sixty days. That gap — thirty versus sixty days — represents thousands of dollars in floorplan interest, depreciation, and opportunity cost on every car you own.
Most independent dealers know their turn rate matters. Fewer track it weekly. Even fewer use it to drive acquisition, pricing, and aging decisions in real time. This piece walks through the formula, current benchmarks, what slows turnover, and the strategies that actually move the needle.
14-day free trial, then $29/mo · Cancel anytime
The Formula: How to Calculate Inventory Turn Rate
Inventory turnover ratio equals your cost of goods sold divided by your average inventory value. If you sold $2.4 million worth of vehicles last year (at cost) and your average inventory value was $200,000, your turn rate is 12.
Another way to calculate it: divide 365 days by your average vehicle inventory age. If your average unit sits forty-six days before it sells, your annual turn rate is roughly eight.
To find days sales of inventory — how long the average unit sits — flip it: divide 365 by your turn ratio. A turn rate of eight gives you roughly forty-six days to turn.
Both formulas get you to the same place. Use whichever fits your reporting tools. The key is consistency: measure the same way every month so you can spot trends.
Current Benchmarks: Gold Standard vs. Reality
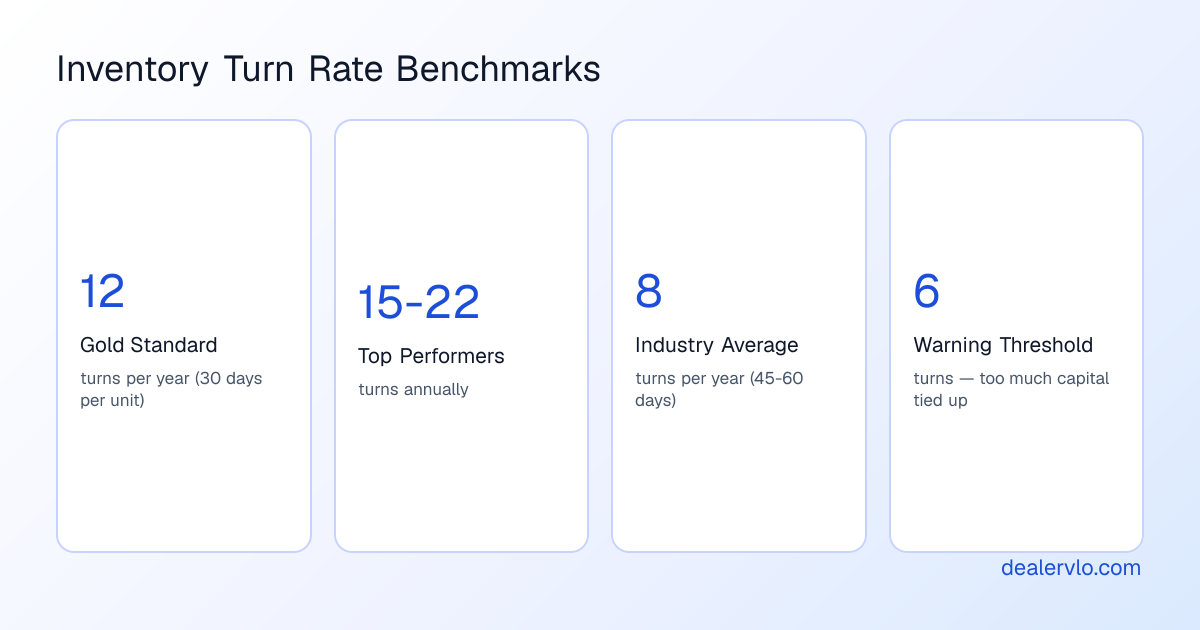
The industry gold standard is twelve turns per year — moving your entire inventory every thirty days. That's the number to chase if you want maximum capital efficiency and minimal holding cost.
Reality looks different. The average U.S. auto dealer in 2022 turned inventory every sixty-three days, less than half the gold standard. By late 2025, used vehicles were averaging fifty days on lots, down from fifty-five days earlier in the year but still above the forty-five-day best-practice threshold many consultants recommend.
For independent used car dealers, a realistic target range is eight to twelve turns annually. If you're running below six turns, you're almost certainly tying up too much working capital in aging stock. Top-performing dealers — the outliers — hit fifteen to twenty-two turns per year by stocking aggressively to local demand and repricing ruthlessly.
Current industry benchmarks for days to turn fall between forty-three and forty-eight days. That's the middle of the pack. If you're consistently under forty-five days, you're in the top quartile. Over sixty days, you're leaving profit on the table.
A common best-practice aging policy: sell fifty percent of your inventory within thirty days of acquisition, and move all used vehicles within forty-five days. Anything approaching sixty days is a warning sign. Beyond that, you're into fire-sale territory.
Get your annual turn rate and days' supply — and see what the same inventory could make at a faster turn.
Open the Inventory Turn CalculatorWhat Slows Inventory Turn — and What It Costs
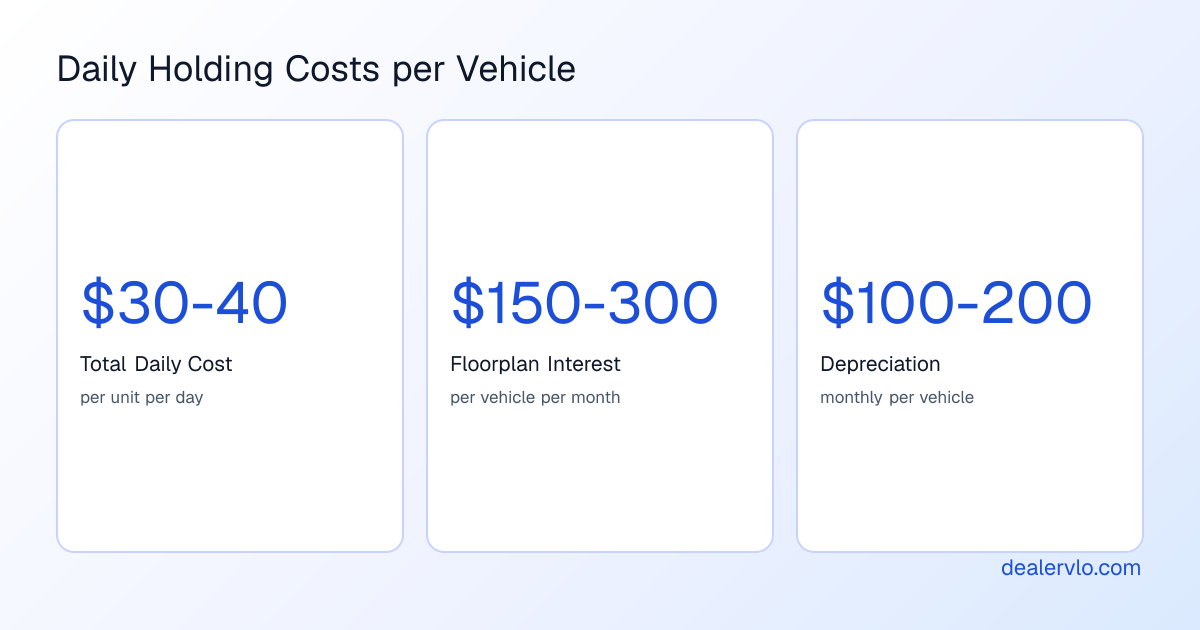
Holding costs in 2026 run thirty to forty dollars per unit per day when you account for floorplan interest, depreciation, and overhead. Floorplan interest alone can hit $150 to $300 per vehicle per month depending on your rate and the vehicle's value. On a hundred-car inventory, that's $30,000 to $50,000 annually just in interest.
Depreciation compounds the pain. Most used vehicles depreciate $100 to $200 monthly, so a unit that looks profitable on paper at acquisition can turn into a breakeven or loser after seventy days on the lot.
The root causes of slow turn are predictable:
- Buying wrong. You stock what you can get at a good price, not what your market is buying this month.
- Reconditioning delays. A vehicle sitting in service for ten days waiting on parts or labor is invisible to buyers and losing value every day.
- Stale pricing. You set a competitive price at acquisition, then let it age while the market moves.
- Inadequate demand forecasting. You don't track which segments, trims, mileage ranges, and price points are actually moving, so you guess.
There's an operational cost, too. Sales teams lose motivation when they're stuck pushing aged units nobody wants. Online shoppers notice when the same car sits in your listings for months and start assuming something's wrong with it or with you. Slow turn creates a negative feedback loop that makes everything harder.
14-day free trial, then $29/mo · Cancel anytime
Actionable Strategies to Improve Inventory Turn
Stock to Your Sales Data, Not Your Gut
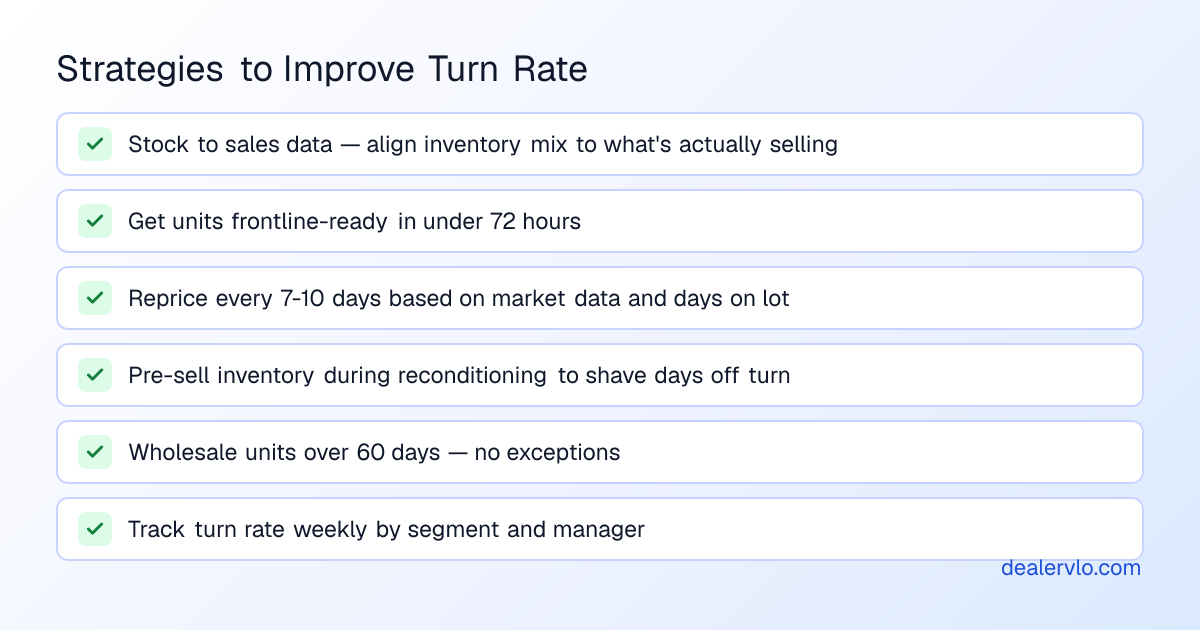
If thirty-five percent of your sales are compact SUVs but only twenty percent of your inventory is compact SUVs, you're understocked in a fast-turn segment and likely overstocked elsewhere. Realign your mix to match what's actually selling and your overall turn rate improves automatically.
Review your last ninety days of sales by make, model, trim, mileage, and price point. Compare that to your current inventory. The gaps tell you what to buy and what to avoid.
Accelerate Reconditioning
Reconditioning can take anywhere from forty-eight hours to ten days depending on staff and vehicle condition. High performers get retail units frontline-ready in under three days. Every day a car sits in service is a day it's not generating leads, showings, or offers.
Set a firm reconditioning standard — seventy-two hours maximum — and track compliance. If parts delays are the bottleneck, identify the common failure points and stock those parts or find faster suppliers.
Reprice Dynamically
The best dealers reprice vehicles every seven to ten days based on market data, days on lot, and lead activity. Pricing too high makes your sales team's job harder. Pricing too low eats gross. Data-driven pricing tools help you stay competitive without guessing. For the step-by-step, see how to price a used car to sell faster.
Implement automatic aging buckets: units over sixty days get marked down automatically unless there's a documented reason to hold.
Pre-Sell During Recon
Most sales teams don't know about a vehicle until it's frontline-ready. By then, you've already burned three to ten days. Get your team involved earlier. Share incoming inventory during or immediately after acquisition so they can match it to customer inquiries and start promoting it before it officially hits the lot.
Pre-selling during recon shaves days off your average turn and reduces the risk of a unit aging past thirty days unsold.
Wholesale Aged Inventory Ruthlessly
Create an aged inventory strategy and stick to it. Units over sixty days should be discounted, wholesaled, or moved to auction — no exceptions. The longer you hold hoping for full gross, the more you lose to depreciation and floorplan interest.
Calculate the true cost of holding a unit an extra thirty days. In most cases, taking a $500 haircut to wholesale at sixty days beats waiting another month for a retail buyer who may not come.
Track Turn Rate Weekly
Daily or weekly turn rate monitoring by segment and manager creates accountability. Your used car manager should know the current turn rate, how it compares to last month, and which specific vehicles are dragging performance down.
Transparency drives better decisions in acquisition, pricing, and wholesaling. When everyone knows the number and sees it move in real time, behavior changes.
How Inventory Turn Ties to Profitability
Fast turn doesn't just reduce holding costs. It frees up capital to buy more inventory, improves cash flow, and lets you take advantage of market opportunities when they show up. A dealer turning twelve times a year with $200,000 in inventory is moving $2.4 million in sales volume. A dealer turning six times with the same $200,000 moves $1.2 million. Same capital, half the revenue.
Faster turn also means fresher inventory, which attracts more buyers, generates more online leads, and gives your sales team better options to show. It's a compounding advantage.
For independent dealers managing inventory with DealerVLO, built-in aging reports, turn rate dashboards, and profitability tracking make it easier to spot problems early. You can see which units are approaching thirty, forty-five, and sixty days, monitor turn rate by segment, and calculate the true cost of holding aged inventory including floorplan and depreciation. That visibility turns inventory turn from a quarterly review metric into a daily operational tool.
The Bottom Line
Inventory turn rate is the clearest single measure of whether your used car operation is healthy or struggling. The gold standard is twelve turns per year — thirty days per unit. Reality for most dealers is closer to eight turns, or forty-five to sixty days. The gap between those numbers is profit you're either capturing or giving away. Turn is one of several numbers worth tracking together — see the full set in the used car dealer benchmarks.
Improving turn starts with buying what your market wants, getting units frontline-ready fast, repricing based on data, and wholesaling aged inventory before it costs more to hold than to move. Track your turn rate weekly, hold yourself accountable to aging thresholds, and make turn a core performance metric alongside gross and volume.
The dealers who turn fastest aren't necessarily the ones with the best margins on every deal. They're the ones who understand that speed is margin — and they structure their entire operation around it.
14-day free trial, then $29/mo · Cancel anytime