Cash Flow for a Used-Car Lot: Where the Money Gets Stuck, Plus a 13-Week Forecast
Why profitable lots run out of cash, where working capital gets stuck, and a 13-week cash forecast you can build in a spreadsheet.
Part of the Floor plan financing guide: How dealer floor plans actually work — and where they quietly eat your gross
Switching from another DMS? Compare DealerVLO to DealerCenter, Frazer, or Lot Wizard.

You can be profitable on paper and still be scrambling to make payroll. That's the disconnect every small-lot owner knows by heart: the accounting says you made money, but the checking account says otherwise. The problem isn't that you're losing money — it's that the money you did make is sitting in unsold inventory, unpaid contracts, or paper you're carrying on a buy-here-pay-here note.
This post walks through the cash cycle of one car from the moment you buy it to the moment you finally collect, the five places working capital gets stuck, and a simple 13-week cash forecast you can maintain in a spreadsheet. The goal is to see liquidity problems coming in time to do something about them — not the day your floor plan calls.
14-day free trial, then $29/mo · Cancel anytime
Profit is not cash on a car lot
Accounting profit and cash are different animals. Your profit-and-loss statement might show a strong month, but if you spent that gross buying more cars, paying curtailments on aged units, or waiting for lenders to fund deals, the cash isn't sitting in your account ready to pay rent or payroll.
Independent used-car dealers are especially vulnerable to this. You're carrying depreciating inventory, you're often on the lower end of floor plan advance rates, and you don't have the credit lines or cash reserves that franchise stores do. A strong sales month can still leave you strapped if you're holding the wrong inventory, discounting aged units, and replacing sold cars with new ones that don't turn fast enough.
The core problem is timing. You pay for a car today — whether in cash or as a floor plan advance. You spend more cash on transport and reconditioning before it's front-line ready. You carry it on the lot, paying interest and curtailments daily. When it finally sells, you wait for the lender to fund the contract. If it's a buy-here-pay-here deal, you collect the cash over months. Every one of those steps is a place where cash gets stuck.
For more on the mechanics of floor plan financing itself — how the advance works, what curtailments are, and how interest compounds — see how dealer floor plans actually work. This post focuses on the timing problem and how to forecast it.
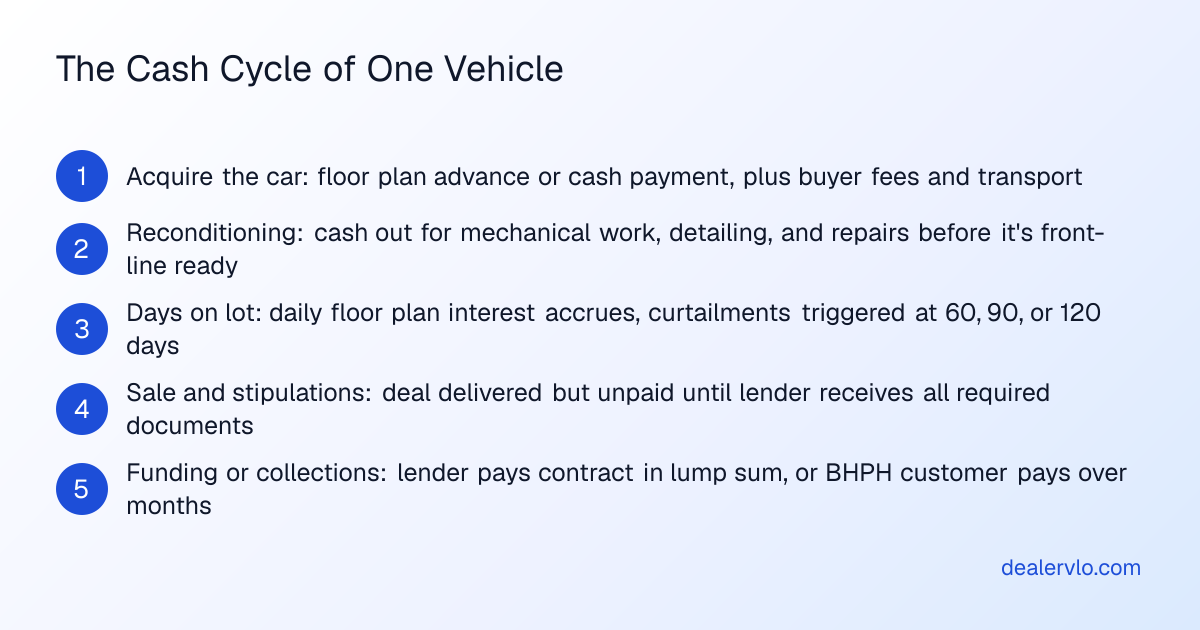
The cash cycle of one car
Walk through what happens to cash from the moment you decide to buy a car to the moment you finally collect the last dollar.
You acquire the car: floor plan or cash
If you floor the car, the lender advances a percentage of its value — typically 75% to 90% for used inventory, and independent dealers often sit toward the lower end of that range. You're still writing a check for the difference between the advance and the hammer price, plus the buyer fee, transport, and anything the floor plan doesn't cover.
If you pay cash, the entire cost is out of your account the day you win the bid. For more on deciding which route to take for a given car, see our floor plan vs. cash decision framework — this post assumes you already know whether the car is floored or owned outright.
Many dealers are paying 7% to 9% on floor plan balances in the current environment, and floor plan expense per vehicle has been climbing as interest rates stay elevated and cars turn slower. One lender's worked example: a $12,000 unit at 12.25% APR, held for 90 days with a curtailment at day 60, racks up $351 in interest plus $170 in fees — $521 total, or about $5.79 a day. That's on top of the principal curtailment itself, which in that example was $1,200 due at day 60.
Curtailment schedules vary by lender, but the structure is consistent: a percentage of the original principal comes due at set intervals — often 60, 90, or 120 days — and the percentage escalates as the unit ages. Most agreements require a curtailment of 10% to 25% once a vehicle crosses 90 to 180 days. The goal is to prevent dealers from carrying stale, depreciating inventory indefinitely. For more on what triggers a curtailment and how to avoid going out of trust, see how to pass a floor plan audit.
You spend cash on transport and reconditioning
Before the car hits the front line, you're paying to get it to the lot and make it retail-ready. Transport, detailing, mechanical work, tires, brakes — every dollar of recon is cash out before the car is ever priced or photographed. If you don't track reconditioning cost line by line and roll it into the car's total cost, your gross looks better than it is, but you're not actually richer — you just measured wrong.
DealerVLO tracks per-car reconditioning costs line by line: vendor, description, and cost. Each line rolls into that car's all-in cost and margin, so you can see exactly how much cash is sitting in each unit before it ever goes live.
The car sits on the lot: daily interest and curtailments
Every day a floored car sits unsold, you're paying interest. If it crosses a curtailment threshold, you're writing a check for the required principal reduction plus a fee. Aging triggers are usually at 60, 90, or 120 days, and some floor plans charge higher rates or additional fees on vehicles past a certain age.
The longer a car sits, the more uncomfortable lenders get. Once a unit crosses 90 days, you're often facing a curtailment, higher fees, or both. That's cash you have to come up with while the car is still on your lot, not cash you get when it sells.
DealerVLO shows days in inventory on every car, flags units at 60+ days, and gives you an aging report bucketed 0–30, 31–60, 61–90, and 90+ days. The earlier you see a car aging, the earlier you can reprice it or wholesale it before it triggers a curtailment. Use the holding cost calculator to see exactly what each day costs.
Put a real dollar-a-day number on every unit sitting on your lot.
Open the Holding Cost CalculatorThe car sells: approved, stipulated, funded
When a buyer drives off the lot, the deal is delivered — but the cash isn't in your account yet. If the customer financed the car, the lender has to fund the contract, and that only happens after every stipulation is satisfied.
Stipulations — stips — are the conditions a lender attaches to an approved loan before releasing funds. Proof of income, proof of residence, a copy of a valid license, proof of insurance, references. The approval is real, but it's conditional. A delivered deal sits in "contracts in transit," unpaid, until the last stip is sent back and accepted.
Stips are one of the most expensive bottlenecks in auto finance. They slow funding, frustrate dealers, and create inconsistent decisioning. When stip requirements are vague or when the lender keeps coming back for more, it drags out for days. That's days your floor plan clock is still running, and days your cash is still tied up in a car that's already gone.
If the deal is subprime or buy-here-pay-here, the funding lag is even longer — or in the case of BHPH, the cash comes back over months, not in one lump sum.
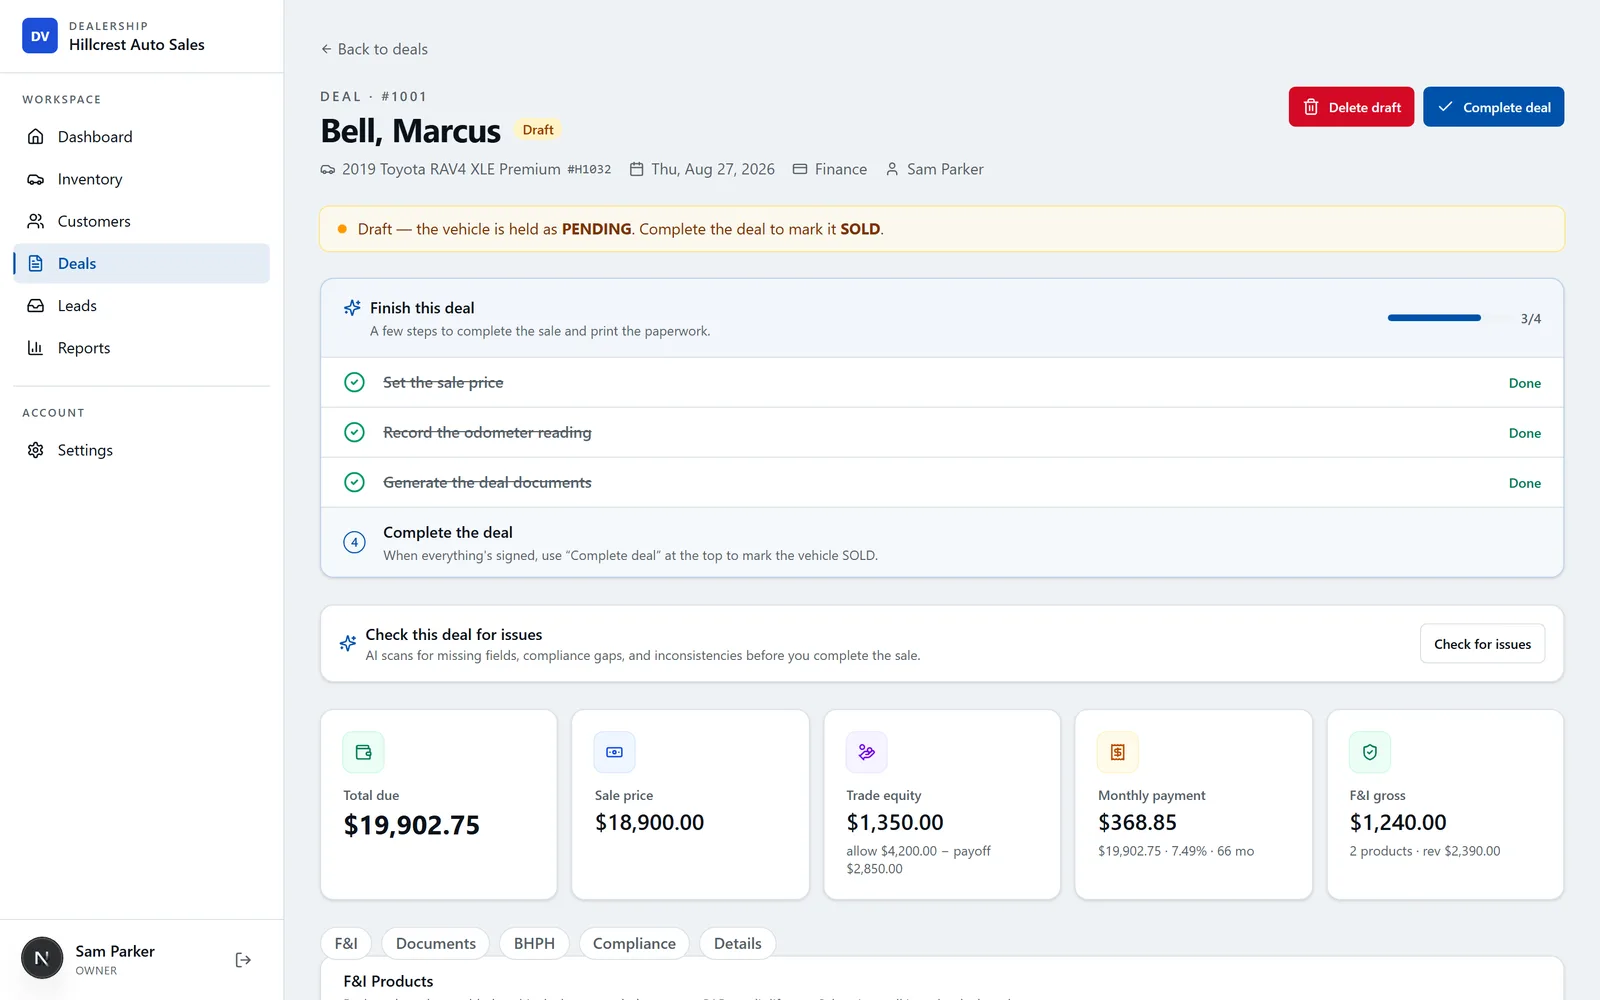
Buy-here-pay-here: cash comes back over months
In buy-here-pay-here, the dealership is the lender. The customer pays you directly, usually weekly or twice a month, and you carry the credit risk. The advantage is you keep the interest income; the disadvantage is your cash is tied up in paper.
One of the most critical metrics in BHPH is cash-in-deal: structuring down payments that cover the vehicle's actual cash value. When you collect the cost of the car upfront, you're only risking your profit margin, not your operating capital. Historically, BHPH down payments were larger than the total profit on the sale, so if the buyer stopped paying, the dealer could repossess the car and sell it again without losing cash.
Collections practices in BHPH directly impact cash flow. Consistent follow-up, clear payment schedules, and quick action on missed payments determine how fast the cash comes back.
DealerVLO has buy-here-pay-here payment tracking with a collections view, so you can see active notes, outstanding balances, payments due today, and past-due accounts in one place. That tells you when the note cash is actually coming in — not just what you're owed on paper.
The five places cash gets stuck
A used car lot running out of money usually has cash trapped in one or more of these spots.
1. Aged units burning floor plan interest and curtailments
A used vehicle that's been in inventory past 60 days is aged. Aged units burn floor plan interest, depreciation, lot space, and eventually trigger curtailments. The compounding cost includes interest, insurance, recon, advertising, potential curtailments, market depreciation, and eventually markdowns. Holding cost compounds daily.
Split your inventory into aging buckets, such as 0–30, 31–60, 61–90, and 90+ days. Watching how units flow between buckets is the earliest signal that something is stuck. If you've got six cars past 60 days and you only sell one or two a week, you're sitting on months of working capital that isn't working.
DealerVLO's dashboard shows a count of units aged 60+ days in the "Needs attention" panel, and the aging report breaks inventory into those same 0–30, 31–60, 61–90, and 90+ day buckets. Every car shows its days on lot, so you don't have to guess which ones are about to cross a curtailment threshold.
2. Reconditioning money spent before the car is front-line ready
You spend cash on transport, mechanical work, detailing, and tires before the car ever hits the lot. That money is gone, but the car hasn't sold yet. If you're buying aggressively and reconditioning multiple cars at once, you can have thousands of dollars tied up in units that aren't even priced yet.
The fix is to track every dollar of recon per car and roll it into the car's cost immediately. DealerVLO logs reconditioning line by line — vendor, description, cost — and each line rolls into that car's all-in cost and margin. You can see exactly how much cash is sitting in a car that's still in the shop.
3. Contracts in transit: deals delivered but not yet funded
A car that's delivered but not funded is a car you no longer own, still sitting on your floor plan, with no cash in the bank. The lender is waiting on stips, the buyer is driving the car, and you're still paying interest. If you've got three or four deals waiting on funding at the same time, that's a meaningful chunk of working capital stuck in limbo.
The only real fix is to stay on top of stips: call the lender, call the buyer, get every document in as fast as possible. Track every deal's funding status so you know which ones are waiting and why.
4. Buy-here-pay-here down payments that don't cover cost
If your BHPH down payment doesn't cover the car's actual cash value, you're financing not just the customer's profit, but your own cost. That means your cash is tied up in the note, and if the customer stops paying, you're repossessing a car you're still in the hole on.
The industry standard is to structure the down payment to cover cost, so the note balance represents profit and carrying cost, not inventory capital. If your down payments are too low, you're using working capital to finance customers instead of to buy more cars.
5. Tax-season buying without a winter cushion
If you buy heavy in tax-refund season — February, March, April — and don't build a cash cushion for summer and fall, you'll run out of cash when sales slow down. The inventory you bought in the spring is still on the lot in July, you're paying floor plan interest on it, and you don't have the cash flow from weekly sales to offset the carry cost.
The fix is to plan for it. Set aside a percentage of your spring gross to carry you through the slower months, or taper your buying as you approach summer so you're not sitting on a full lot when traffic drops.
Build a 13-week cash forecast
A 13-week rolling cash forecast is a simple spreadsheet that shows you exactly how much cash you'll have at the end of each week for the next three months. It accounts for every inflow and outflow by week, so you can see a cash crunch coming in time to adjust.
The columns you need
Your forecast needs five columns per week:
- Opening balance — the cash in the bank at the start of the week.
- Cash in — all money that hits the bank account that week: funded deals, down payments, BHPH payments, wholesale proceeds, tax refunds, anything else.
- Cash out — all money leaving the account: auction purchases, floor plan curtailments, recon bills, payroll, rent, utilities, floor plan interest, insurance, advertising, any other overhead.
- Net cash flow — cash in minus cash out.
- Ending balance — opening balance plus net cash flow. This becomes next week's opening balance.
The rows: what to track
Break cash out into categories so you can see where the money actually goes:
Cash in:
- Funded deals (contracts that paid out this week)
- Down payments (BHPH or cash sales)
- BHPH payments collected
- Wholesale proceeds (cars you sold to other dealers or at auction)
- Other income
Cash out:
- Auction purchases (hammer price plus fees)
- Floor plan payments (curtailments, payoffs when a car sells)
- Reconditioning (transport, mechanical, detailing, tires)
- Payroll
- Rent
- Floor plan interest
- Insurance
- Advertising
- Utilities and other overhead
- Taxes
For more on categorizing overhead and building a full profit-and-loss view, see how to build a profit & loss statement for your used-car lot. The P&L measures profitability; the cash forecast measures liquidity. They're both necessary, and they tell different stories.
A worked example (with clearly labeled example numbers)
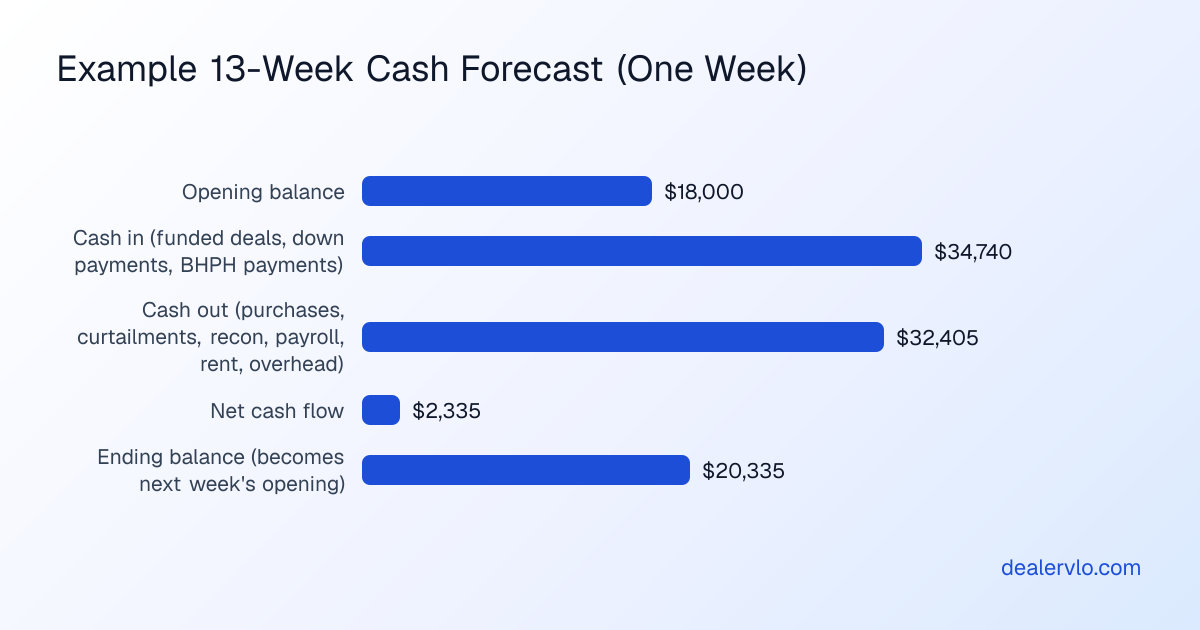
Say you start the week with $18,000 in the bank. Here's what one week might look like:
Week 1:
- Opening balance: $18,000
- Cash in:
- Two funded deals: $16,500 and $14,200 (the amounts the lenders funded)
- One down payment (BHPH): $3,200
- BHPH payments collected: $840
- Total cash in: $34,740
- Cash out:
- Three cars bought at auction: $7,800, $9,200, $6,500 (including buyer fees)
- One curtailment (90-day unit): $1,800
- Reconditioning (two cars): $1,350
- Payroll: $2,400
- Rent: $2,000
- Floor plan interest (weekly accrual): $285
- Advertising: $650
- Utilities and other: $420
- Total cash out: $32,405
- Net cash flow: $34,740 – $32,405 = $2,335
- Ending balance: $18,000 + $2,335 = $20,335
Week 2 opens with $20,335. If you project this out 13 weeks, you can see the low point coming. Maybe week 8 is when you have two curtailments due, payroll, and no deals funded yet — and your balance drops to $4,200. That's not a crisis yet, but it's a signal: you need to push units, delay a purchase, or plan for it now rather than scrambling when it happens.
The forecast is only useful if you update it every week. At the end of each week, replace the forecast numbers with what actually happened, roll the forecast forward one more week, and adjust your projections based on what you're seeing.
14-day free trial, then $29/mo · Cancel anytime
Weekly habits that keep the forecast honest
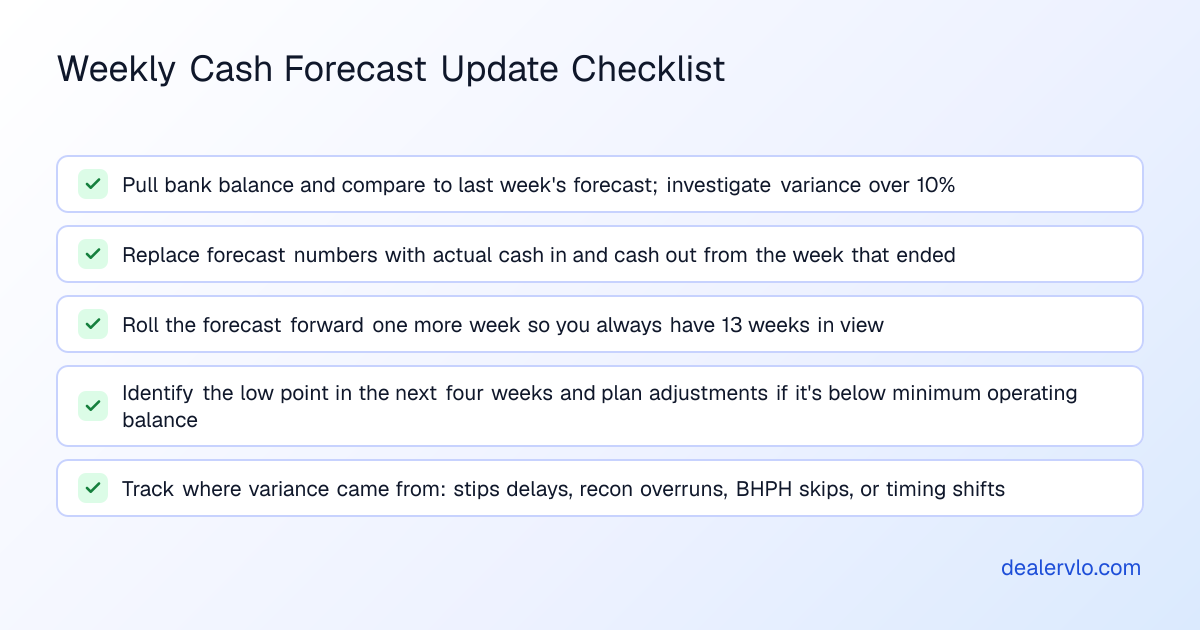
A forecast is a guess. The only way it becomes useful is if you update it with real numbers every week and adjust your plan accordingly.
Every Monday (or Friday, depending on your rhythm):
- Pull your bank balance and compare it to last week's forecast. If you're off by more than 10%, figure out why — did a deal fund late, did you miss an expense, did a BHPH customer skip a payment?
- Update the forecast with actual numbers from the week that just ended.
- Roll the forecast forward one more week, so you always have 13 weeks in view.
- Look at the low point in the next four weeks. If it's under your minimum operating balance, decide now what you'll do: delay a purchase, push an aged unit, wholesale something, or line up a short-term cash injection.
Track where the variance comes from. If your forecast said three deals would fund and only one did, that's a stips problem or a closing-speed problem. If recon came in $800 over forecast, that's a buying problem or an inspection problem. The forecast isn't just about predicting cash — it's about learning which assumptions you keep getting wrong.
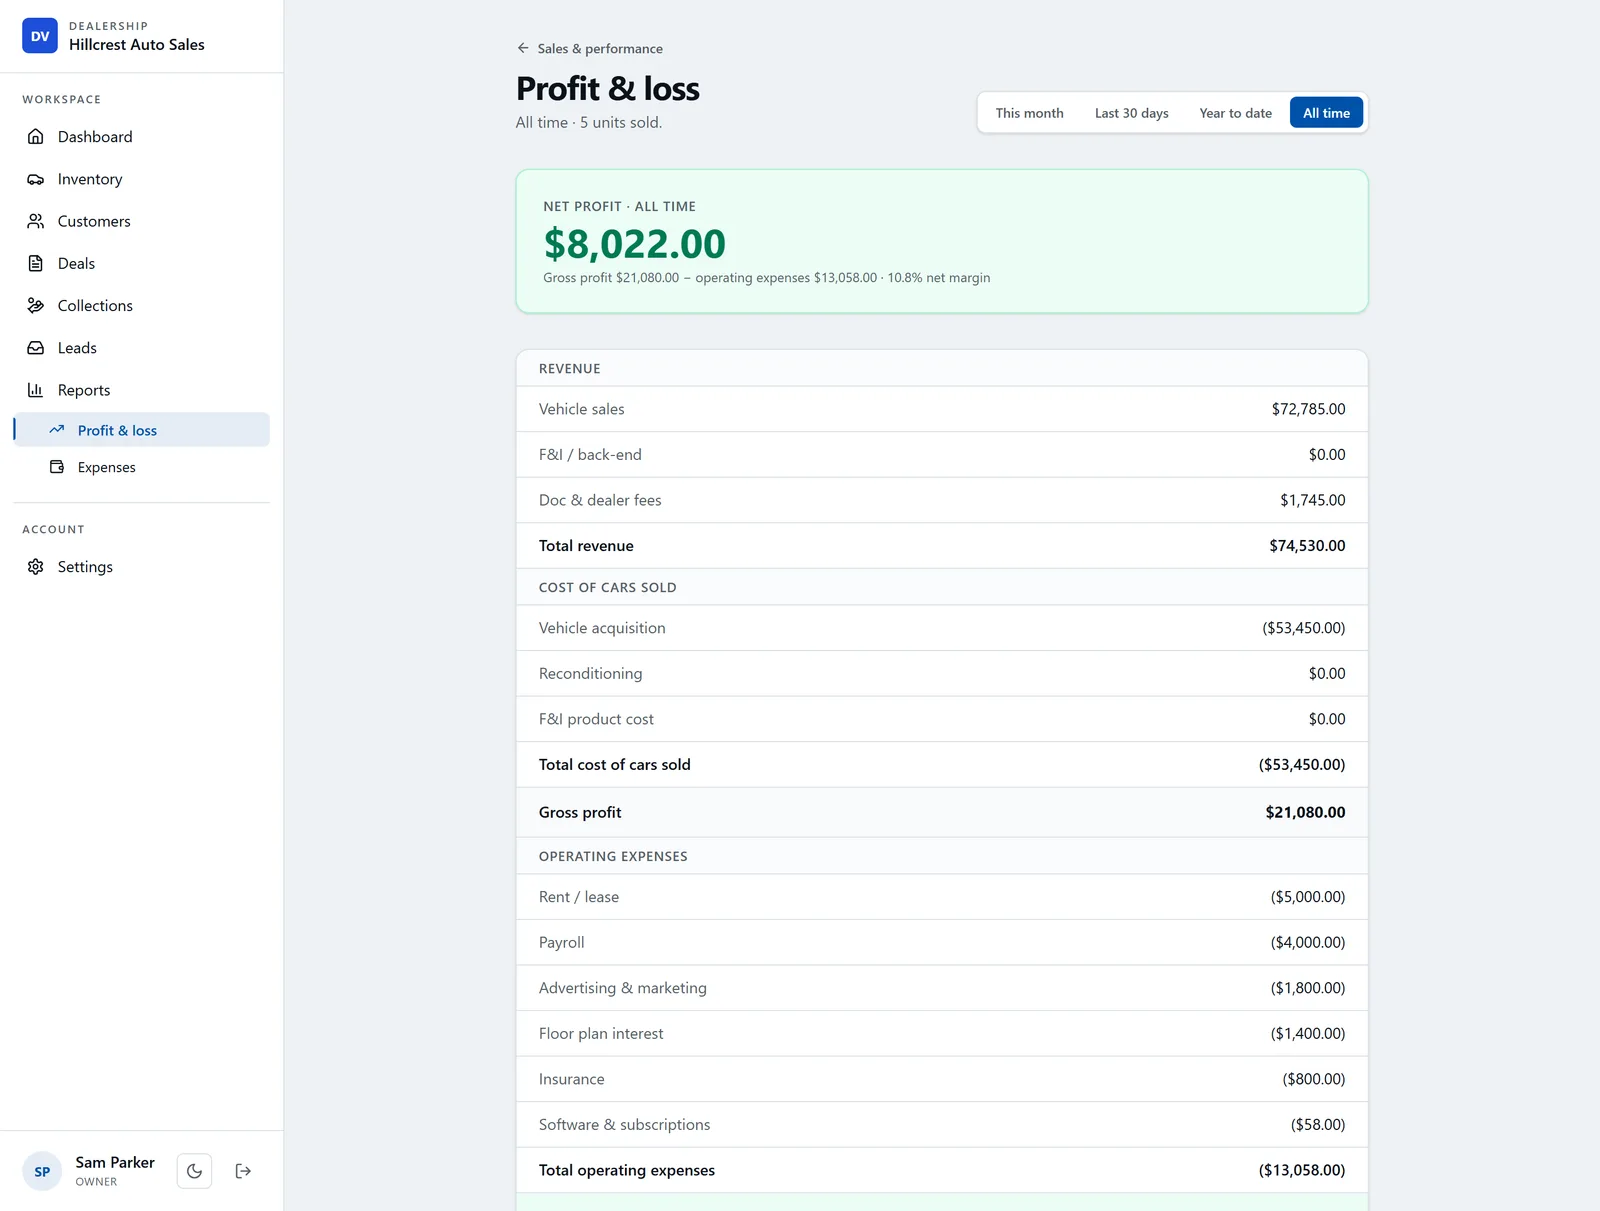
DealerVLO's profit-and-loss view tracks overhead by category — rent, payroll, floor plan, advertising, insurance — as one-time or recurring monthly expenses. That gives you a baseline for the "cash out" side of the forecast. Every car shows its days in inventory, so you know which ones are about to cross a curtailment threshold. BHPH payment tracking shows when note cash is actually coming in. And the per-car cost with recon lines shows exactly how much cash is sitting in inventory before it's even front-line ready.
DealerVLO does not connect to QuickBooks or any outside accounting software, and it does not show a total inventory value on the dashboard or in reports — you'll calculate that separately when you build the forecast. It's not a lender, and it doesn't provide floor plan financing; for more on choosing a floor plan provider, see NextGear vs. AFC vs. Westlake.
Where DealerVLO fits
DealerVLO doesn't build the 13-week forecast for you — that's a spreadsheet exercise, and the format above gives you the structure. But it does give you the real-time data you need to keep the forecast honest.
Every car shows its days in inventory, its all-in cost including reconditioning, and whether it's approaching the 60-day aging flag. The aging report breaks inventory into 0–30, 31–60, 61–90, and 90+ day buckets, so you can see which cars are about to become cash problems. The profit-and-loss view tracks recurring overhead by category, so you know your weekly burn rate. And if you're running buy-here-pay-here, the payment tracking shows active notes, outstanding balances, and past-due accounts, so you can see when the note cash is actually coming in.
The goal is to see liquidity problems coming in time to do something about them. A forecast doesn't prevent cash crunches — but it gives you four weeks of warning instead of four hours.
For more on the other ways cash leaks out of a used-car lot, see the common ways used-car dealers lose money and is your used-car lot actually profitable?.
Frequently asked questions
What is a cash flow forecast for a used car dealership?
A cash flow forecast is a week-by-week projection of the cash you'll have in the bank, accounting for every dollar in and every dollar out. It's different from a profit-and-loss statement: the P&L measures whether you made money, and the forecast measures whether you'll have enough cash to operate. A 13-week rolling forecast is the standard format for small dealers.
Why does a used car lot run out of money even when it's profitable?
Because profit is not the same as cash. You can have strong gross profit on paper while your cash is tied up in aged inventory, unpaid contracts waiting on lender stips, or buy-here-pay-here notes that pay back over months. The timing problem — cash out today, cash in later — is what causes liquidity crunches even at profitable lots.
How often should I update my dealership cash forecast?
Update it every week. At the end of each week, replace the forecast numbers with what actually happened, roll the forecast forward one more week, and adjust your assumptions based on the variance. A forecast you build once and never touch is useless — the value is in seeing how your assumptions compare to reality and learning which ones you consistently get wrong.
What are curtailments on a floor plan and how do they affect cash flow?
A curtailment is a required principal reduction on a floored vehicle that hasn't sold by a certain age — usually 60, 90, or 120 days. Curtailment schedules vary by lender, but the structure is consistent: you have to pay down a percentage of the original principal, often 10% to 25%, plus a fee. That's cash you have to come up with while the car is still on your lot, not when it sells. Curtailments are one of the biggest cash drains on aged inventory.
How much cash should I keep as a cushion for a used car lot?
There's no universal rule, but most small independent dealers aim to keep enough cash to cover two to four weeks of total overhead — payroll, rent, floor plan interest, insurance, utilities — plus enough to handle one or two unexpected curtailments. If your weekly burn rate is $6,000, you'd want at least $12,000 to $24,000 in reserve. Build your 13-week forecast and look at the low point: that tells you what cushion you actually need.
What's the difference between a cash forecast and a profit and loss statement?
A profit-and-loss statement measures profitability: revenue minus cost of goods sold minus overhead equals net profit. A cash forecast measures liquidity: opening balance plus cash in minus cash out equals ending balance. The P&L tells you if you made money; the forecast tells you if you'll have enough cash to operate. You need both, and they often tell very different stories — a profitable month can still leave you short on cash if the timing is wrong.
Bottom line
Profit and cash are not the same thing on a used-car lot. You can be profitable on paper and still run out of money if your working capital is stuck in aged units, unfunded deals, or BHPH paper. A 13-week rolling cash forecast shows you the low points coming in time to adjust — whether that means pushing an aged car, delaying a purchase, or lining up short-term cash.
The forecast is a simple spreadsheet: opening balance, cash in, cash out, net cash flow, ending balance, repeated 13 times. Update it every week with real numbers, roll it forward, and learn from the variance. The earlier you see a cash crunch coming, the more options you have. Build your forecast, keep it honest, and run your lot on data instead of hope.
14-day free trial, then $29/mo · Cancel anytime
Estimate your daily floor-plan carrying cost per unit.
Open the Floor Plan Calculator