Used Car Dealership KPIs: The Weekly Scorecard for a Small Lot
Track 8-10 lot-level metrics that matter for a small used-car dealer: units, gross, days to sale, aging, recon, leads, overhead, and cash.
Part of the Profit, margins & the numbers guide: How Do Used-Car Dealerships Actually Make Money?
Switching from another DMS? Compare DealerVLO to DealerCenter, Frazer, or Lot Wizard.
Why a small lot needs 10 numbers, not 17
When you run a 30-car independent lot, the big-store KPI dashboards don't fit. You won't see service absorption (you don't have a shop), CSI scores (you don't have factory allocations riding on them), or F&I penetration by product (you aren't tracking warranty-versus-GAP ratios when you're closing the deal yourself). A franchise store with six sales managers and a forty-bay shop needs seventeen metrics because seventeen people need direction. You need the ten numbers that tell you whether the lot is making money this week and where to spend Monday morning when it isn't.
The scorecard below is what matters at lot level: how many cars you sold, what you made on each one, how long they sat, how much recon cost, where your leads came from and how many closed, what overhead ran, and how much cash is tied up on the ground. These are the used car dealer metrics to track every week if you want to catch a problem while you can still fix it, not at month-end when the check has already bounced.
14-day free trial, then $29/mo · Cancel anytime
The scorecard: 10 numbers every Monday
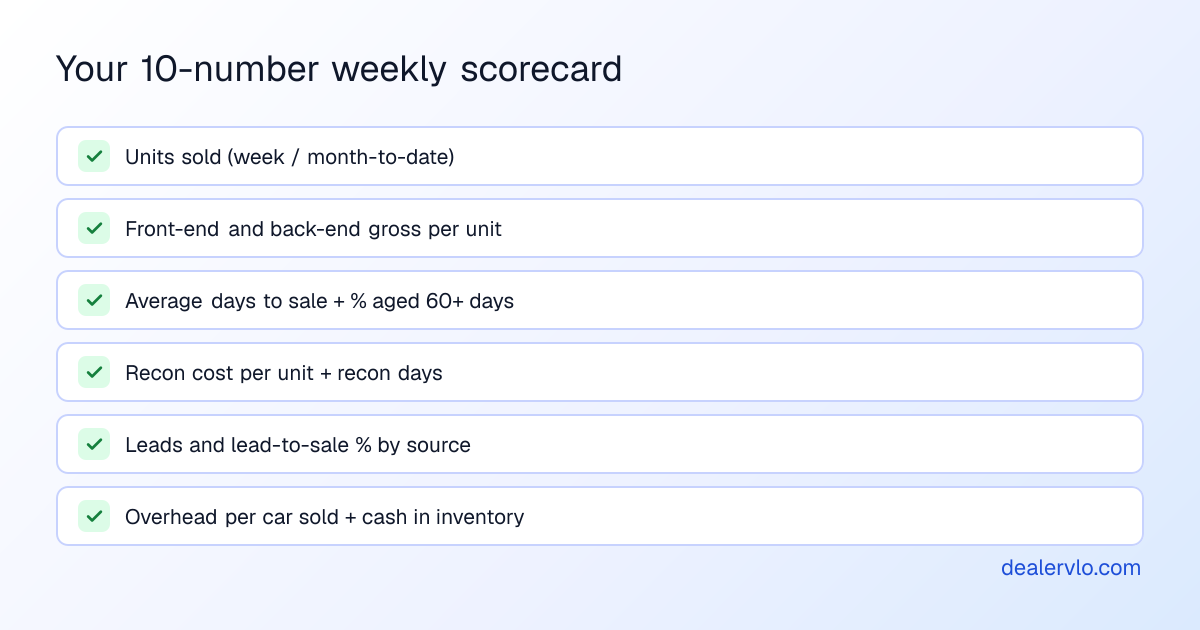
This is your one-page weekly scorecard. Print it, fill it in, and you'll know in ten minutes whether the lot is healthy or bleeding.
| KPI | Formula / Source | Red flag | First move |
|---|---|---|---|
| Units sold (week / month-to-date) | Count of closed deals | Behind your weekly run rate two weeks in a row | Check lead volume and follow-up speed; if leads are flat, check your online price against comps |
| Front-end gross per unit | Selling price − acquisition cost − recon − pack | Below your trailing 90-day average two deals in a row | Check whether you're buying too high or pricing to move aged units; review your last three purchases |
| Back-end gross per unit | F&I income per deal (warranty, GAP, service contract) | Falling or zero on cash deals | Offer a product on every deal, cash or financed; even a $400 warranty is $400 you didn't have |
| Average days to sale | For cars sold this week: date sold − date listed, averaged | Above 60 days | Price the next three oldest cars to move this week; don't wait for 90 |
| % of inventory aged 60+ days | Count of cars on the lot 60+ days ÷ total inventory | Above 15–20% of your inventory | Pick the three oldest, drop them $500 each, and get them gone; every day past 60 costs you $30–$40 in holding cost |
| Recon cost per unit (avg) | Total recon spend this week ÷ units reconditioned | Creeping above $1,800 or spiking on one car | Compare what you're spending to what the car will gross; if recon is eating half your margin, you bought wrong |
| Recon days (avg) | Date frontline ready − date acquired, averaged | Above 10 days | Call the shop; every day a car sits in recon is a day it isn't on your site earning a lead |
| Leads and lead-to-sale % by source | Count by source (online, walk-in, referral) and deals closed ÷ total leads | Lead volume down or conversion under 20% | If volume is down, check your active listings; if conversion is low, track how fast you're responding |
| Overhead per car sold | Total monthly overhead ÷ units sold that month | Rising faster than gross per unit | Look at your largest line items (rent, floor plan, advertising); one of them grew and you didn't notice |
| Cash tied up in inventory | Sum of (acquisition cost + recon cost) for every car on the lot | Above your credit line or growing faster than sales | Stop buying until you move three cars; cash on the curb earns nothing |
DealerVLO gives you most of these numbers without a spreadsheet. The dashboard shows available inventory, new leads this week, active deals, and cars sold this month with total revenue. The sales report breaks out front-end and back-end gross per deal, the aging report buckets your inventory at 0–30, 31–60, 61–90, and 90+ days, and every car shows its days on the lot and its line-by-line recon cost. Every lead records its source, so you know whether CarGurus is converting or just eating your budget.
The three numbers to check every Monday morning
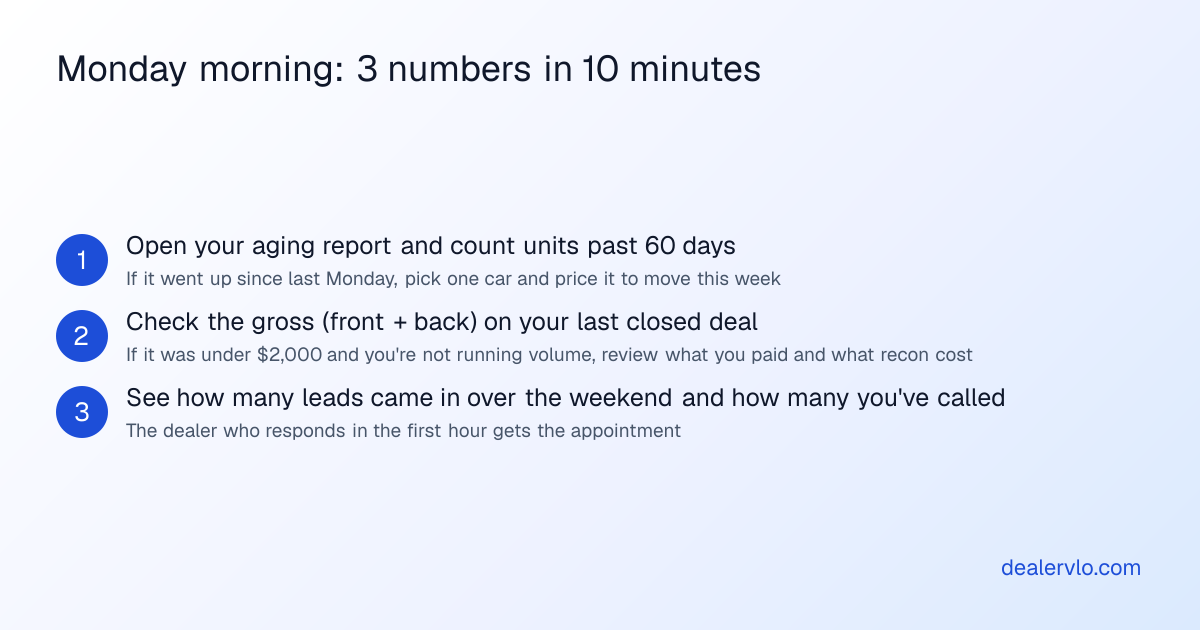
You don't need to fill in the whole scorecard every day, but three numbers tell you whether you have a fire to put out before Tuesday:
-
How many aged units do you have right now? Open your inventory aging report and count the cars past 60 days. If that number went up since last Monday and you didn't buy anything, you have cars stalling out. Pick one, price it to move, and get it gone this week.
-
What did you gross on the last deal you closed? Front-end plus back-end, all in. If it was under $2,000 total and you aren't running a volume store, you left money on the table or you bought a car you shouldn't have. Check what you paid and what you spent on recon before you buy the next one like it.
-
How many leads came in over the weekend, and how many have you touched? If ten leads came in and you haven't called five of them by Monday noon, your conversion rate is going to tank. The dealer who calls in the first hour gets the appointment; the one who waits until Monday afternoon gets voicemail.
In DealerVLO all three are a click or two away: the dashboard shows a count of units aged 60+ days under "Needs attention" and the new leads awaiting contact, the sales report shows the gross on every deal, and the lead list shows each lead's source and status.
14-day free trial, then $29/mo · Cancel anytime
Set your targets from your own last 90 days, not industry benchmarks
Every KPI article you read will tell you healthy days to sale is under 45, recon should be under $1,500, and front gross should hit $2,500. Those are averages from franchise stores, CarMax, and wholesale-to-retail flippers running three hundred cars. They are not your lot.
If you run a 25-car independent lot in a market where the average retail price is $18,000, your front gross might run $2,200 and your days to sale might be 52, and if you're profitable at that and turning inventory, you're doing fine. If you try to hit a $3,000 front-end number by holding out on price, you'll age out half your inventory and eat the margin in holding cost instead.
Set your own targets from your last 90 days of closed deals. Pull every deal you sold in the last quarter, add up the front gross, divide by the number of deals, and that's your baseline. Do the same for days to sale, recon cost, and overhead per car. Then ask whether you can improve your number by 10 percent in the next 90 days—not whether you can hit someone else's benchmark from a different market, a different mix, and a different cost structure.
The DealerVLO sales report gives you the trailing gross per deal automatically, so you don't need to export and add it up by hand. Every car shows its days on the lot, so averaging days to sale across the cars you sold is quick arithmetic, and the P&L totals your overhead, which you divide by the cars you sold to get overhead per car. Those three numbers, from your own last ninety days, are your small dealership performance metrics—not the ones from a dealer group in a different state.
What numbers big stores track that you can skip
If you read a dealership KPI guide written for a franchise store, you'll see metrics that don't apply to a small independent lot. Here's what to ignore and why:
Service absorption. This is the percentage of a dealership's fixed costs covered by service and parts gross. If you don't have a service bay, you don't have a service department to absorb anything. Skip it.
Customer Satisfaction Index (CSI). Franchise dealers track this because the factory ties allocations and holdback to it. You don't have a factory. You care whether a customer comes back or sends a referral, but you don't need a scored survey to know that—you'll hear about it when they call or don't.
F&I product penetration by product. A big store tracks what percentage of deals took a warranty versus GAP versus a service contract because six F&I managers are selling and they need to know who's leaving money on the table. If you're the one presenting the products, you already know whether you offered them. Track total back-end gross per deal; that's the number that matters.
Individual salesperson metrics. If you have a sales team, track their performance separately—units sold, gross per deal, closing rate, and days to sale per salesperson. We cover that in detail in how to measure salesperson performance. For lot-level KPIs, you want the aggregate numbers across the whole team, not a leaderboard in your weekly scorecard.
Inventory turn rate detail. Turn rate is a useful trailing indicator—it tells you how many times a year you cycled your inventory—but it isn't an actionable weekly number. You calculate it once a month or once a quarter to see whether you're turning faster or slower than you were, but on Monday morning you care about which cars are sitting, not the denominator of an annualized ratio. If you want to understand the turn-rate formula and when to use it, we wrote a separate guide: used-car dealer inventory turn rate.
Get your annual turn rate and days' supply — and see what the same inventory could make at a faster turn.
Open the Inventory Turn CalculatorWhere small lots leak on the KPIs they do track
Tracking the right car dealership KPI scorecard is half the job; the other half is acting on it fast enough that the problem stays small. Here's where a lot of small lots know the number but let it slide:
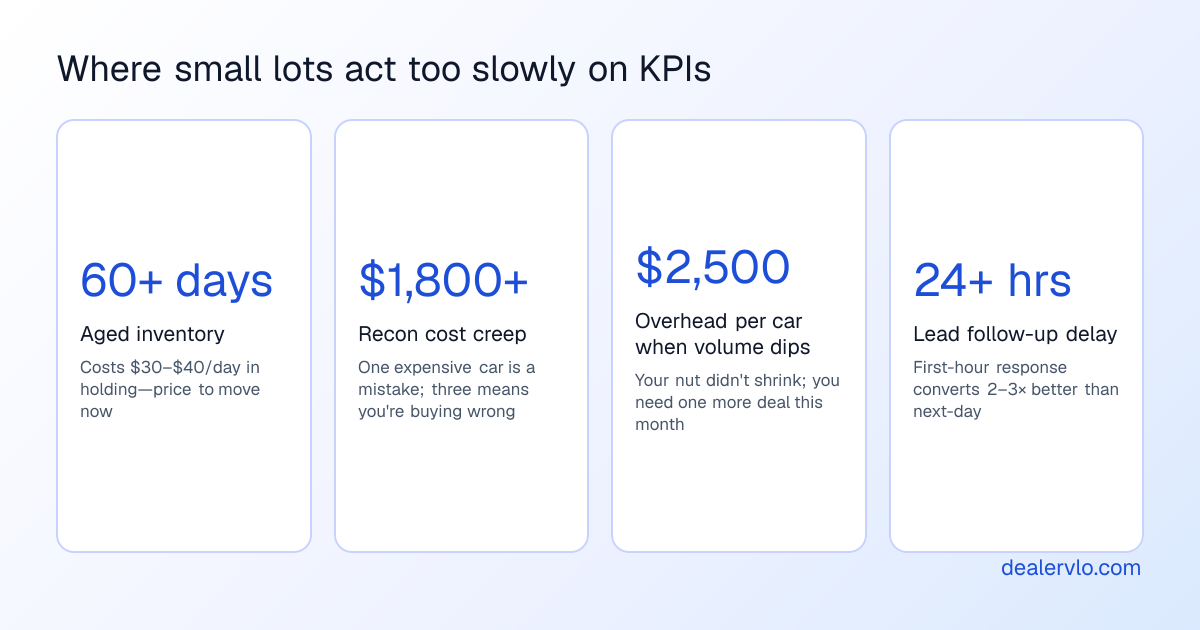
Aged inventory. You know you have four cars over 60 days, but you keep waiting for the right buyer instead of repricing them to move. Industry estimates put holding cost at $30–$40 per vehicle per day when you account for floor-plan interest, insurance, and depreciation. At 75 days that car has cost you $2,250 in carry; if you'd dropped it $1,000 at day 60 you'd have saved $600 and freed up the cash to buy something that turns.
Recon cost creep. One car needs $2,400 in work and you approve it because you've already bought the car and you want to get it out front. Then the next one needs $1,900, and now your average recon cost is $1,650 and eating your margin. If a car's going to cost more than $1,800 to recon and you're only going to gross $2,500 front-end, you bought it wrong—wholesale it and move on.
Overhead per car when volume dips. Your monthly nut is $15,000 and you normally sell ten cars, so overhead runs $1,500 per car. Then you have a slow month and only sell six cars, and overhead just jumped to $2,500 per car. Your gross per unit didn't change, but your profit per car fell by a thousand dollars. You need to know that number every week so you can push to close one more deal before the month ends, not discover it on the thirty-first when it's too late.
Lead follow-up speed. You track lead volume and you know conversion is falling, but you don't track how fast you're responding to each lead. The dealer who calls in the first hour closes at two or three times the rate of the one who waits until the next day. DealerVLO timestamps every lead the second it comes in and records whether you've contacted them, so you can see on Monday morning that eight leads came in over the weekend and you haven't touched four of them.

How to pull these numbers without a second system
If you run the lot on a DMS that doesn't give you a dashboard or an aging report, you're probably pulling these numbers from three places: a deal log in the DMS, an inventory spreadsheet, and a handwritten tally of what came in and what sold. That works until you get busy and forget to update the spreadsheet for two weeks, and now your aged count is wrong and you don't know your recon average.
DealerVLO calculates most of this automatically. Every car counts its days in inventory from the day it's added, so days on the lot updates every day without you touching it. Recon costs log line by line on the car—vendor, description, cost—and roll up into that car's all-in cost and margin, so your recon average is always current. The deal jacket computes front-end and back-end gross live as you fill in the sale price, trade value, and F&I products, and the sales report totals them across every closed deal.
The aging report buckets your inventory at 0–30, 31–60, 61–90, and 90+ days, and the dashboard shows a count of units over 60 under "Needs attention" so you see the problem the day it crosses the threshold. Lead source is recorded on every inquiry—whether it came from your dealer website, CarGurus, Cars.com, a walk-in, or a referral—so you can calculate lead-to-sale percentage by source without a separate lead log.
The one number DealerVLO doesn't calculate for you is cash tied up in inventory, because the system doesn't show a total inventory value on the dashboard. You'll need to add up the acquisition cost plus recon cost for every car on your lot to get that figure, but since every car shows its all-in cost on its detail page, it's a ten-minute job once a week instead of a monthly surprise.
Overhead per car comes from the P&L: DealerVLO records your recurring and one-time expenses by category (rent, payroll, floor plan, advertising, insurance), totals them, subtracts them from your gross profit, and shows you net. Divide total monthly overhead by the unit count from the dashboard and you have overhead per car sold.
14-day free trial, then $29/mo · Cancel anytime
A worked example: what the Monday check catches
Say it's Monday, April 7. You open the dashboard and see:
- Available inventory: 28 cars
- Units aged 60+ days: 5 cars (that's 18% of your inventory)
- New leads this week: 14 (three came in Sunday night and you haven't called them yet)
- Cars sold this month: 2 (it's the seventh, so you're a bit behind your normal pace of one a week)
- Revenue this month: $37,400
You open the aging report and see the five cars over 60 days: a 2019 Malibu at 67 days, a 2018 Escape at 71 days, a 2020 Sentra at 64 days, a 2017 Accord at 88 days, and a 2016 Camry at 103 days. The Camry has been on the lot since January 3 and has cost you over $3,000 in holding cost. You're into it for $9,200 all-in and it's priced at $12,995. You drop it to $11,495, and the new price reaches CarGurus and your other listing sites with the next daily feed. If it sells this week at that price you'll gross $2,295 front-end minus the $3,000 you already burned holding it, so you're net negative $700 on the car—but if you hold it another month hoping for twelve-nine you'll be negative $1,900 instead.
You open the sales report and check the two deals you closed last week: $2,100 front-end and $850 back-end on the first one, $1,950 front-end and $400 back-end on the second. Total gross per unit averaged $2,650 last week, which is a bit below your 90-day average of $2,850, but not a disaster. You check what you paid for those two cars and see you bought them both at auction and paid about right for the market; the lower gross came from pricing them to move because they'd both been on the lot 50+ days when you sold them.
You open the lead inbox and call the three Sunday leads before 10 a.m. One books an appointment for Wednesday, one says they bought somewhere else Saturday, and one goes to voicemail. You mark them all contacted and move on.
That ten-minute Monday check just told you to price one car to move, confirmed your gross is still healthy, and got you an appointment for mid-week. If you'd waited until Friday to look at the numbers, the Camry would have sat another five days and the Sunday lead would have bought from someone else.
How often to review the full scorecard
The Monday check is three numbers and takes ten minutes. The full scorecard—all ten KPIs filled in, with notes on what moved and why—is a once-a-week job, and most dealers do it Monday morning or Friday afternoon.
Fill it in the same day every week so you catch trends before they become problems. If your aged percentage goes from 12% one week to 18% the next and you don't look at it again for two weeks, you'll have six cars over 60 days and $7,200 burning in holding cost before you reprice anything.
Some dealers print the scorecard and pin it next to the desk; others keep it in a spreadsheet with one row per week so they can see the trend over the last quarter. Either way works as long as you actually look at it and act on the red flags the same week they show up.
If you're running month-end close on the last day of the month, you'll fill in the scorecard one more time with the full month's totals—units sold, average gross front and back, average days to sale for everything you sold that month, total recon cost divided by units reconditioned, total overhead divided by units sold, and ending cash tied up in inventory. Those become your trailing 90-day baseline when you review the quarter.
What to do when a number breaks your target
Tracking the KPI is easy; knowing what to do when it moves is harder. Here's the first move for each one when it crosses into the red:
Units sold behind pace: Check your active listings first. If you have ten cars on the ground and only six are live on CarGurus, you're losing leads you should be getting. Then check your online price against comps—if you're $1,500 over the market on half your inventory, that's why the phone isn't ringing.
Front-end gross falling: Compare what you're paying at auction to what you're selling for retail. If you're paying 85% of retail and spending $1,400 on recon, you're leaving yourself $800 in margin before doc fee and overhead—buy cheaper or sell higher. If you're pricing cars to move because they're aged, that's a buying problem two months ago, not a pricing problem today.
Back-end gross near zero: Offer a product on every deal, financed or cash. A $600 warranty on a cash deal is $600 you wouldn't have made otherwise, and the customer who pays cash is often the one willing to spend another few hundred for peace of mind. If you aren't offering, you're leaving it on the table.
Days to sale climbing above 60: Price the three oldest cars to sell this week and stop buying until they move. The market is telling you they're priced wrong; don't wait for the perfect buyer.
Aged percentage above 15–20%: Pick the car that's been sitting longest, drop it $500 or $1,000, and push it on every channel you have—your dealer website, your listing feeds, and your Facebook page. Get it gone and free up the cash.
Recon cost spiking: Pull the last five cars you reconditioned and see what you spent on each one. If they're all running $1,200–$1,500, that's fine. If one car cost $2,600 because it needed a transmission and the rest were $900, you know the problem was that one car—don't buy another one like it. If they're all creeping toward $1,800, you're buying cars that need more work than you thought, so inspect harder at the auction or adjust what you're willing to pay.
Recon days over 10: Call the shop and ask what's holding cars up. If it's parts delay on one vehicle, that's life. If it's because the shop is backed up on other work and your cars are sitting in line, you need a different shop or a standing weekly slot.
Lead conversion under 20%: Track how fast you're responding. If you're calling back in the first hour and still converting under 20%, your price or your inventory mix is wrong. If you're waiting a day to respond, start there—speed matters more than the script.
Overhead per car rising: Open your expense tracker and see which line item grew. If floor-plan interest jumped $1,200, you're carrying too much inventory too long. If advertising jumped because you added another listing site, check whether it's paying for itself in leads.
Cash tied up growing faster than sales: Stop buying for two weeks and sell what you have. Cash on the curb earns nothing, and if you're borrowed to the limit you're one slow month away from a margin call.
How DealerVLO keeps the scorecard in front of you
The hardest part of tracking what numbers should a used car lot track weekly isn't deciding which numbers matter—it's making sure you actually look at them every Monday instead of letting the week get away from you. DealerVLO keeps the critical metrics on the dashboard so they're the first thing you see when you log in: available inventory, new leads with a count of how many came in this week, active deals, and cars sold this month with total revenue.
Below that, the "Needs attention" section only shows the items that apply: new leads awaiting contact, active deals missing a price or odometer, cars without a price, cars without photos, and units aged 60+ days. If you don't have any aged inventory, the section doesn't show it—so when it does appear, you know you have a problem to address.
Every car's detail page shows its days on the lot and its line-by-line recon cost, so you don't need to open a separate aging report or a spreadsheet to see which car is eating margin. The sales report breaks out front-end and back-end gross for every closed deal, and you can filter by date range to see this week, this month, or your trailing 90 days. The aging report buckets your inventory at 0–30, 31–60, 61–90, and 90+ days, and every lead records its source so you can calculate lead-to-sale by channel without a separate log.
The system doesn't mark prices down automatically or send you aging alerts by email, because those alerts get ignored. Instead, the aged count sits on your dashboard every time you log in, and it stays there until you reprice the car or sell it. That's enough of a nudge to make you act on it the same week it crosses 60 days, not two weeks later when it's at 75.
The P&L records your recurring and one-time expenses by category, totals your gross profit from deals, subtracts your overhead, and shows net. You can see overhead per car by dividing your monthly total by the unit count, and because every expense logs with a date and a category, you can see which line item grew when your overhead-per-car number spikes.
All of this runs in a web browser at $29 a month, flat, with no per-deal or per-user fees. You don't install anything, you don't export to a spreadsheet, and you don't wait until month-end to find out a car sat for 90 days because you forgot to check the aging tab. The numbers are there every Monday, and acting on them is what keeps a small lot profitable.
Frequently asked questions
What KPIs should a small used-car dealership track weekly?
Track units sold, front-end and back-end gross per unit, average days to sale, percentage of inventory aged over 60 days, average recon cost and recon days, leads and lead-to-sale conversion by source, overhead per car sold, and total cash tied up in inventory. These ten numbers tell you whether the lot is making money and where to spend Monday morning when it isn't. Franchise-store KPIs like service absorption, CSI scores, and F&I product penetration don't apply to a 30-car independent lot.
How do I calculate my dealership's average days to sale?
For each car you sold, subtract the date you listed it from the date you sold it; that's days on lot for that car. Add up the days for every car sold in the period (week or month) and divide by the number of cars sold. That's your average days to sale. Industry ranges run 45–60 days, but set your target from your own last 90 days of closed deals instead of chasing someone else's benchmark from a different market.
What's a red flag for aged inventory on a small lot?
When more than 15–20 percent of your inventory has been on the lot over 60 days, you have a problem. Every day past 60 costs $30–$40 in holding cost from floor-plan interest, insurance, and depreciation. Pick the three oldest cars, drop them $500 to $1,000 each, and get them sold this week—don't wait for 90 days hoping the right buyer walks in.
Should I track individual salesperson metrics on my weekly scorecard?
No. Salesperson metrics—units sold per person, gross per deal, closing rate, and days to sale by rep—belong on a separate report you review with your sales team. The weekly lot-level scorecard tracks aggregate numbers across the whole dealership so you know whether the business is healthy. If you want to measure salesperson performance in detail, see our guide on how to measure salesperson performance at a used-car dealership.
How do I set realistic KPI targets for my dealership?
Pull your last 90 days of closed deals and calculate your actual averages: front-end gross per unit, back-end gross per unit, days to sale, recon cost per unit, and overhead per car sold. Those are your baseline numbers. Then ask whether you can improve each one by 10 percent in the next 90 days—not whether you can hit an industry benchmark from a different market with a different cost structure. Your own trailing numbers are far more useful than a national average from franchise stores or wholesale flippers.
What's the fastest way to pull these numbers without a second system?
If your DMS doesn't give you a dashboard or an aging report, you're pulling these numbers from a deal log, an inventory spreadsheet, and a handwritten tally. DealerVLO calculates most of it automatically: every car tracks its days on the lot, recon costs log line by line and roll into the car's margin, the deal jacket computes front-end and back-end gross live, and the aging report buckets inventory at 0–30, 31–60, 61–90, and 90+ days. The dashboard shows available inventory, new leads this week, cars sold this month with revenue, and a count of units aged 60+ days under "Needs attention."
Bottom line
You don't need a seventeen-metric dashboard to run a profitable used-car lot. You need ten numbers you can fill in every Monday in ten minutes, targets you set from your own last quarter instead of someone else's benchmark, and the discipline to act on a red flag the same week it shows up. Track units sold, gross per unit front and back, days to sale, aged inventory percentage, recon cost and days, lead conversion by source, overhead per car, and cash on the ground. When one of them breaks your target, you'll know what to fix and where to start—and that's what keeps a small lot from leaking money one car at a time.
14-day free trial, then $29/mo · Cancel anytime
Before you authorize the work: see whether a repair earns back its cost plus the holding days it adds.
Open the Recon ROI Calculator