Is Your Dealership Marketing Working? Measure Cost Per Car Sold
Cost per lead looks good but you're bleeding money? Learn how to measure cost per car sold and spot channels losing money before they sink you.
Part of the Marketing, leads & your website guide: Used Car Dealer Marketing: What a Small Lot Should Do First — and What to Skip
Switching from another DMS? Compare DealerVLO to DealerCenter, Frazer, or Lot Wizard.
You can have the lowest cost per lead on the lot and still lose money on every car those leads produce. The metric that tells you whether your marketing actually works isn't how much you pay for a form fill — it's how much you pay to put someone in a car, and whether the gross on that car clears the cost of getting them there.
Most dealers track cost per lead because it's easy to calculate and the platforms hand it to you. But cost per lead measures volume, not value. A $30 lead that closes at two percent costs you $1,500 per sale. A $78 lead that closes at ten percent costs you $765 per sale. The second channel costs more than twice as much per lead but delivers cars at half the cost — and if you're only watching cost per lead, you'll cut the wrong one.
This is about measurement, not budgeting. If you need help figuring out how much to allocate across channels in the first place, start with our guide to setting a used car dealer marketing budget. This post assumes you're already spending — it's about tracking whether that spend is producing profitable sales.
14-day free trial, then $29/mo · Cancel anytime
The Formula That Actually Tells You If Marketing Is Working
Cost per car sold is straightforward: total marketing spend divided by the number of cars sold from that channel. If you spent $5,000 on Google Ads last month and sold ten vehicles from those leads, your cost per sale is $500.
The number that matters is whether your average gross profit per car clears that cost per sale with enough margin left to cover the rest of your overhead. If your front-end gross on used cars averages $2,500 and a marketing channel costs you $3,000 per sale, that channel is underwater — even if the cost per lead looks reasonable.
Industry benchmarks give you a reference point, but your own lot's numbers are what matter. According to recent NADA data, the average franchised dealership spends around $739 per vehicle sold on advertising across all channels. Most single-rooftop stores land between $500 and $700 per new vehicle retailed on marketing. Independent used-car dealers typically run leaner — you're working with tighter gross and smaller volume, so a $700 cost per sale can wipe out your profit before you pay rent.
The gap between cost per lead and cost per sale comes down to close rate. If you're closing twelve percent of leads from one channel and three percent from another, the second channel needs to cost a quarter as much per lead just to break even on cost per sale. Most dealers don't run that math until they notice the bank account doesn't match the lead volume.
Why Cost Per Lead Lies (And Cost Per Sale Doesn't)
Cost per lead can look like progress even when you're selling fewer cars, burning more desk time, and giving up gross. A lower cost per lead sounds efficient — you're paying less for each form fill or phone call — but it tells you nothing about whether those leads turn into money.
Here's the pattern a lot of small lots see: a new lead source comes in with a $25 cost per lead, half what you're paying elsewhere. You shift budget toward it. Lead volume doubles. But sales stay flat or drop, because the new leads close at a third the rate of your old ones. You're paying less per lead and more per sold car, and you won't see it until you do the division.
A marketing channel that delivers a $30 cost per lead but closes at two percent costs you $1,500 per car sold. Another channel with a $78 cost per lead that closes at ten percent costs $765 per sale. The difference is close rate, and close rate is shaped by lead quality, response speed, and how well the source matches your inventory and market.
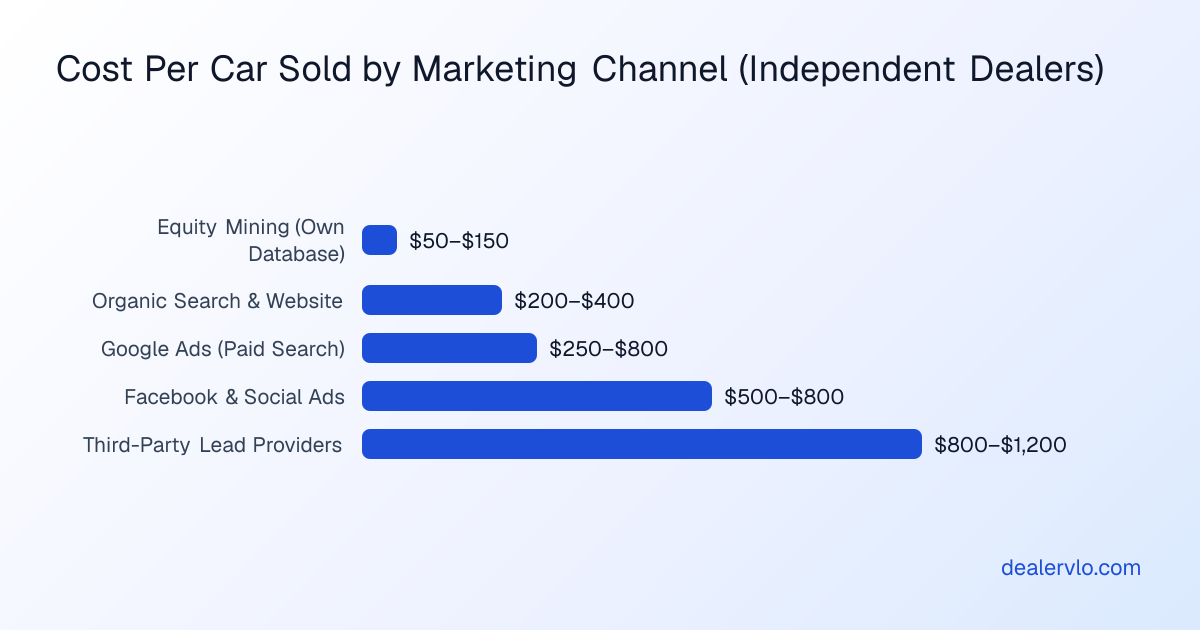
Third-party lead providers often show this pattern. The cost per lead looks competitive — $50 to $80 — but when you account for duplicates, tire-kickers, and out-of-market contacts, the true close rate on third-party leads runs closer to twelve percent, and the cost per sale climbs past $800. Meanwhile, leads from your own Google Ads or organic search might cost $40 each but close at fifteen to twenty percent, putting your cost per sale in the $200 to $400 range.
One analysis found third-party providers costing $12,000 per vehicle sold versus $765 for self-generated search leads — a sixteen-times difference hidden in a flat monthly subscription fee. The subscription looks like a fixed cost, so dealers don't divide it by cars sold. When you do, the math changes fast.
Turn your ad spend into a cost per car sold and a real ROI — and see how many units the spend has to produce just to break even.
Open the Marketing ROI CalculatorHow Close Rate Multiplies (Or Kills) Your Marketing Cost
Leads times close rate equals cars sold. If you generate 100 leads and close ten percent, you sold ten cars. If you spent $4,000 for those 100 leads, your cost per sale is $400. Drop the close rate to five percent and the same $4,000 now costs you $800 per car.
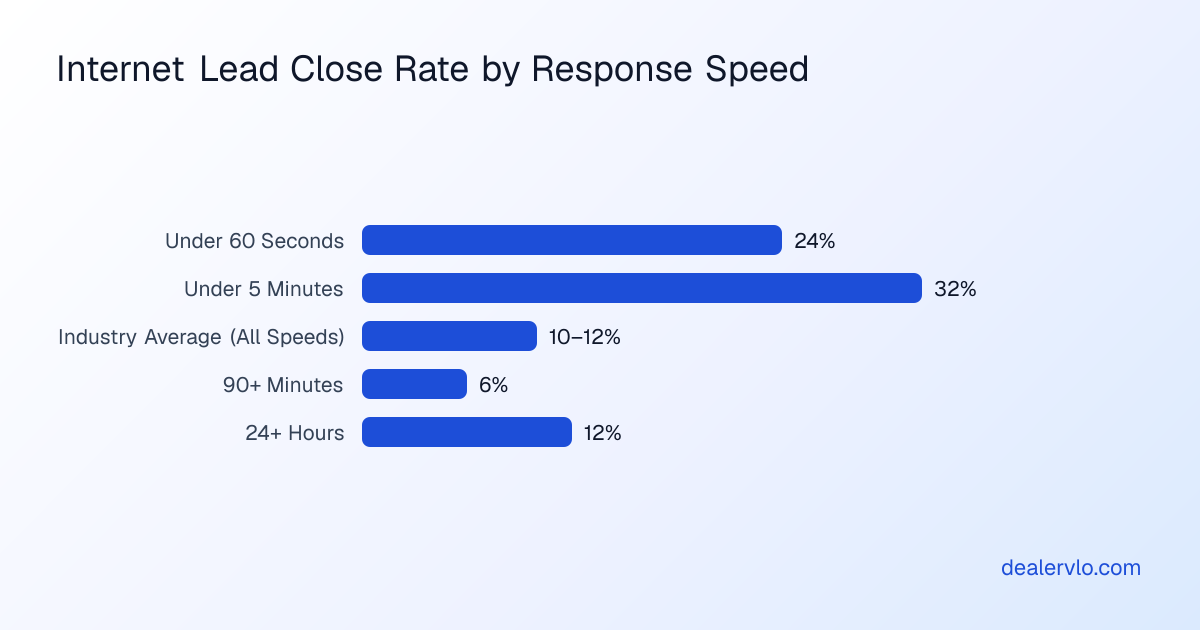
The industry-average close rate on internet leads sits around ten to twelve percent. That's blended across all sources — search, social, third-party, retargeting. The range is wide because close rate is heavily dependent on response speed and lead source. Stores that connect a live voice within sixty seconds close around twenty-four percent of leads. Stores that take ninety minutes or longer close closer to six percent.
Response speed has a significant impact on close rates — the faster you pick up the phone, the better your conversion. If you're tracking cost per lead but not response time, you're measuring the wrong side of the equation.
Phone leads convert at a much higher rate than web forms — around seventy-four percent appointment-set rate versus forty percent for internet leads. If you're running call tracking and routing those calls to someone who answers live, your cost per sale on phone traffic will almost always beat your cost per sale on form fills, even if the cost per lead is higher.
The top ten percent of dealerships close eight to ten percent of internet leads, which tells you the median is below eight. If your lot is closing three to five percent and you're wondering why marketing feels expensive, the problem probably isn't the cost per lead — it's what happens after the lead arrives.
How to Calculate Cost Per Sale by Channel (And Spot the Bleeders)
You need three numbers for each marketing channel: total spend, total leads, and total sold units attributed to that channel. Pull spend from your bank statement or accounting software. Pull sold units from your DMS. Pull attribution from your CRM — and if your CRM shows thirty percent of sales as "unknown source," your cost per sale calculations are meaningless until you fix attribution.
Create a simple monthly table with one row per channel. Columns: channel name, total spend, leads generated, cost per lead, sold units, close rate, cost per sale, average gross per sale, and gross profit minus marketing cost. Sort by cost per sale, then look at the bottom number in the last column — that's your true profit after marketing cost.
Here's a worked example. Say you're running three channels:
Google Ads: $2,000 spend, 50 leads, $40 CPL, 8 sold, 16% close rate, $250 cost per sale, $2,400 avg gross, $2,150 net.
Facebook Ads: $1,500 spend, 100 leads, $15 CPL, 4 sold, 4% close rate, $375 cost per sale, $2,200 avg gross, $1,825 net.
Cars.com subscription: $1,200 spend, 30 leads, $40 CPL, 1 sold, 3.3% close rate, $1,200 cost per sale, $2,500 avg gross, $1,300 net.
All three show reasonable cost per lead — nothing alarming. But the third channel is eating $1,200 of your gross on every car it produces, leaving you $1,300 to cover overhead, floor plan, and everything else. If your average total cost to own and recondition a car is $800 (purchase, transport, recon), you've got $500 left for rent, salaries, and profit. That's not sustainable at any volume.
The first channel, meanwhile, costs you $250 per sale and leaves $2,150 of gross intact. If you're allocating budget equally across all three because they all "generate leads," you're leaving money on the table.
This is why cost per lead is dangerous — it flattens channels that perform very differently once you account for close rate and gross. The math that matters is whether the gross profit on the cars a channel produces clears the cost of that channel with enough margin left to run your business.
You also need to track gross profit by source, because not all leads produce the same gross. Walk-ins and referrals tend to deliver higher gross than internet leads — the customer is further along, less price-focused, and not shopping five other lots in parallel. If a channel delivers a low cost per sale but the customers it brings consistently hammer you on price and walk with $800 gross, it's not the win the cost per sale suggests.
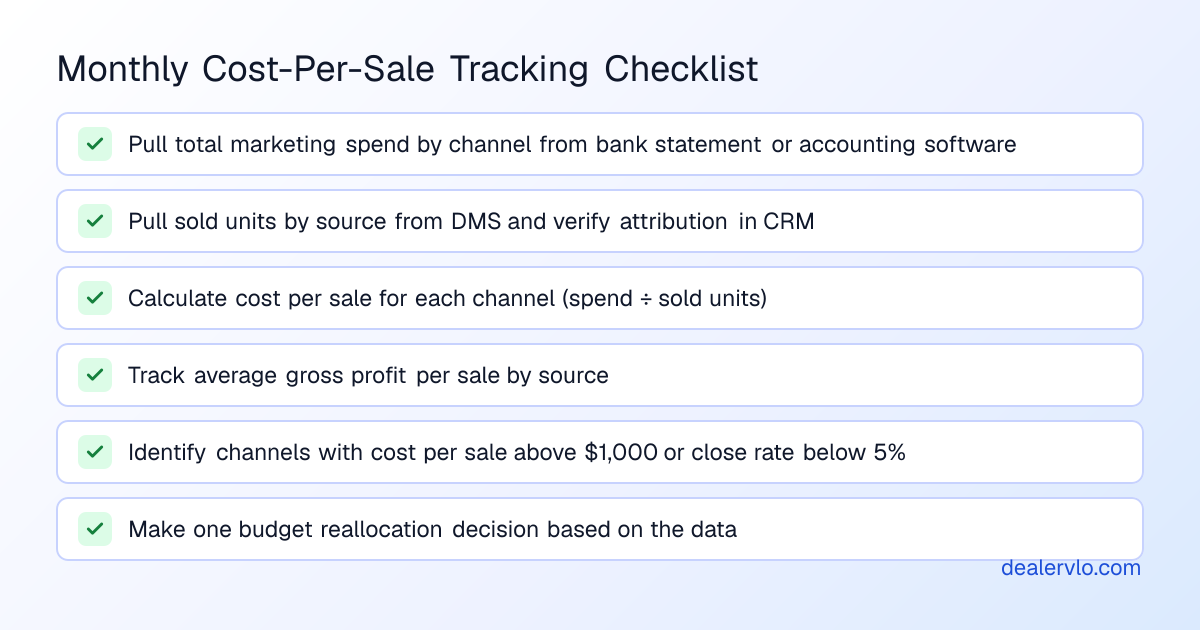
Run this report monthly. Identify outliers — channels with cost per sale above $1,000, or channels with close rates below five percent. Those are your budget-reallocation candidates. If a channel has been running below a ten percent close rate for three months, either fix your follow-up process or move the money.
What Good Cost Per Sale Looks Like by Channel
Not all channels should cost the same per sale, because they serve different parts of the funnel and deliver different lead quality. Self-generated traffic from your own website, organic search, and repeat customers typically delivers the lowest cost per sale — often $200 to $400 — because those leads are high-intent and you're not paying a third party for access.
Paid search through Google Ads generally runs $250 to $800 per sale when managed well, depending on your market and competition. That includes offline conversions — people who click your ad, visit the lot without filling out a form, and buy. If you're only counting web conversions, your real cost per sale is lower than your platform reports.
Social media ads (Facebook, Instagram) tend to show lower cost per lead but also lower close rates, because the audience is earlier in the shopping process. Cost per sale on social typically lands between $500 and $800, though some stores see it climb past $1,000 if they're targeting broadly and not filtering for in-market buyers.
Third-party lead providers — the big listing sites with flat monthly subscriptions plus per-lead fees — often deliver the highest cost per sale, running $800 to $1,200 or more. The leads are shared across multiple dealers, heavily shopped, and full of duplicates. A detailed analysis found that a $50-per-lead third-party source, after accounting for thirty percent duplicates, fifteen percent tire-kickers, and ten percent out-of-market contacts, leaves you with 45 legitimate leads per 100. At a twelve percent close rate, that's 5.4 sales per 100 leads. If you spent $5,000 for those 100 leads, your cost per sale is $925 — nearly four times what self-generated search would cost you.
Equity mining — reaching out to customers with positive equity positions who are candidates for an upgrade — can generate sales at a cost of $50 to $150 per unit when you're working your own database. That's the lowest cost per sale of any channel, because you already have the relationship and the data. If you're spending $1,000 a month on a third-party lead provider and ignoring your own customer list, you're paying ten times as much for a stranger as you would to sell another car to someone who already bought from you.
Independent dealers typically work with smaller budgets and tighter gross than franchised stores, so a cost per sale that's sustainable for a franchise might put you underwater. If your average front-end gross is $2,000 and a channel costs you $1,200 per sale, you're left with $800 to cover acquisition cost, recon, overhead, and profit. That's tight. For most independent lots, a sustainable cost per sale sits below $500 — and the lower you can push it through better close rates and owned channels, the more room you have when a car needs extra recon or a deal gets thin.
14-day free trial, then $29/mo · Cancel anytime
The Attribution Problem (And How to Work Around It)
Cost per sale only works if you know which channel produced which sale. Most small lots struggle with attribution because their CRM isn't consistently updated, salespeople don't ask how the customer found you, and walk-ins don't always trace back to a specific ad.
One analysis found only eight percent of automotive sales fully traceable in dealer CRM systems. If thirty percent of your sales show "unknown source," your cost-per-sale calculation for every channel is wrong — you're dividing spend by attributed sales, but some of those sales came from channels you're not crediting.
The fix is process, not software. Train everyone who takes a call or greets a walk-in to ask, "How'd you hear about us?" and log it in the CRM before the test drive. If your used car dealer software makes logging source frictionless, it'll actually happen. If it takes three clicks and a dropdown, it won't.
For paid channels, use tracking phone numbers and UTM parameters so you can tie a lead to a specific campaign even if the customer doesn't remember where they saw your ad. For organic and walk-in traffic, accept that attribution will be fuzzy and allocate a portion of sales to "direct / unknown" rather than inventing a source.
If you're running Google Ads, enable offline conversion tracking and upload your sold deals back to Google so it can connect clicks to closed sales. Most dealers skip this step and only see the web leads, which makes paid search look less effective than it is. Someone who clicks your ad, visits the lot, and buys without filling out a form still came from that ad — but if you're not tracking offline conversions, Google has no way to show you that sale.
The goal isn't perfect attribution — it's good enough attribution that you can make confident budget decisions. If you know eighty percent of your sales sources and the other twenty percent are spread evenly across channels, your cost-per-sale rankings will still be accurate enough to spot the winners and the losers.
When Cost Per Sale Looks Fine but the Channel Still Loses Money
A channel can deliver a reasonable cost per sale and still lose you money if the gross profit on those deals is lower than your average. This happens most often with high-competition lead sources where the customer is shopping aggressively and expects you to match the lowest price they found online.
If your average gross profit is $2,500 but cars sold from a specific lead source average $1,800 gross, and that channel costs you $600 per sale, you're netting $1,200 per car before operating expenses. Meanwhile, a referral that costs you nothing and closes at $2,800 gross nets you $2,800. Both are profitable, but one is twice as profitable as the other, and if you're allocating budget based only on cost per sale, you'll miss it.
Track average gross profit per sale by source in the same spreadsheet where you track cost per sale. If you see a pattern — a lead source consistently delivering below-average gross — you've found a channel that might not be worth scaling, even if the cost per sale is reasonable.
The other failure mode is volume. A channel might deliver a fantastic cost per sale — say, $150 — but only produce one sale a month. That's great ROI, but it's not enough volume to build a business around. You still need higher-cost, higher-volume channels to hit your unit goals. Cost per sale tells you efficiency; it doesn't tell you scale.
Setting Up a Monthly Cost-Per-Sale Review
Pick one day a month — same day every month, right after you close the books — and pull the numbers. Total marketing spend by channel from your bank statement. Sold units by source from your DMS. Leads by source from your CRM or ad platforms.
Build a simple spreadsheet or report with the columns listed earlier: channel, spend, leads, cost per lead, sold units, close rate, cost per sale, average gross, and net profit after marketing cost. Sort by cost per sale, then by net profit.
Identify outliers — anything with cost per sale above $1,000, or close rate below five percent. Ask why. Is it the lead source, or is it your follow-up process? If you're not calling leads back within an hour and you're closing three percent, the problem isn't the leads.
Make one budget decision per month based on the data. Move $500 from the highest-cost channel to the lowest-cost channel and track what happens. If you're running a channel that hasn't produced a sale in sixty days, pause it and reallocate the budget.
If you're handling dealer paperwork manually and it's taking 45 minutes per deal, you're also burning time that could go toward faster lead follow-up — which, as we've seen, has a direct and massive impact on close rate and cost per sale. The faster you can get a sold deal documented and out the door, the faster you can get back to working the lead pipeline.
This isn't complicated analysis. It's division and sorting. But most dealers don't do it, because cost per lead is easier to pull and the platforms surface it automatically. Cost per sale takes fifteen minutes of manual work every month. That fifteen minutes will tell you whether you're spending money or making it.
What to Do When a Channel Is Bleeding You
You'll eventually find a channel where cost per sale is above your average gross profit, or close enough that there's no margin left for operating expenses. You have three options: fix it, limit it, or kill it.
Fixing it means improving close rate. The fastest way to improve close rate is response speed — if you're taking two hours to call back leads from this channel and thirty minutes to call back leads from another, start there. A dealer who cuts response time from ninety minutes to five minutes can more than double their close rate, which cuts cost per sale in half.
The second fix is better qualification. If a lead source sends a lot of tire-kickers, add a qualification question early in the conversation — "Are you looking to buy in the next week or two, or still researching?" — and prioritize accordingly. You'll spend less time on leads that weren't going to close, and your effective close rate on serious buyers will climb.
Limiting it means capping your spend on that channel. If a third-party subscription is costing you $1,200 a month and producing one sale, you're paying $1,200 per sale. You can't make that cheaper, but you can decide whether one sale at $1,200 is worth it given what else you could do with that budget. Maybe it is — if that sale nets you $1,500 after cost, you made $300. But you're not going to scale it.
Killing it means pausing or canceling the channel and reallocating the budget. If a channel has run for three months with cost per sale above $1,500 and there's no clear fix, cut it. Move that budget to a channel that's working, or bank it. A dollar not spent on a losing channel is a dollar of profit.
The mistake dealers make is letting a channel run indefinitely because "it's generating leads." Leads don't pay your rent. Sold cars at a profit pay your rent. If the leads aren't turning into profitable sold cars, the channel is costing you money, and cost per lead won't show you that — only cost per sale will.
Frequently Asked Questions
What is a good cost per car sold for a used car dealer?
A sustainable cost per car sold for an independent used-car dealer typically sits below $500, and the best-performing channels often deliver $200 to $400 per sale. Industry averages for franchised dealerships run $500 to $740 per vehicle sold, but independent lots work with tighter gross profit margins and need to keep marketing cost lower to stay profitable. If your cost per sale on a channel exceeds half your average gross profit, that channel is eating too much margin.
How is cost per car sold different from cost per lead?
Cost per lead measures how much you pay for a form fill or phone call, while cost per sale measures how much you pay for an actual sold vehicle. A channel can have a low cost per lead but a high cost per sale if the leads don't close. For example, a $30 lead that closes at 2% costs $1,500 per sale, while a $78 lead that closes at 10% costs only $765 per sale. Cost per sale accounts for close rate and tells you the true cost of putting someone in a car.
Why is my cost per lead low but my sales are down?
Low cost per lead usually means you're getting higher lead volume from a cheaper source, but if those leads close at a lower rate, you'll sell fewer cars despite more leads. This happens when a new lead source delivers lower-quality contacts — more tire-kickers, duplicates, or out-of-market buyers. The volume looks good and the cost per lead looks efficient, but the math that matters is leads times close rate equals cars sold, and if close rate drops enough, sales drop even when lead count climbs.
How do I track which marketing channel produced each sale?
Ask every caller and walk-in how they heard about you and log it in your CRM before the test drive. Use tracking phone numbers for paid channels so calls automatically tag to a campaign, and add UTM parameters to all your digital ads so web leads trace back to the source. For paid search, enable offline conversion tracking and upload your sold deals back to the platform so it can connect clicks to closed sales. You won't get perfect attribution, but if you know the source of eighty percent of your sales, you can make confident budget decisions.
What close rate should I expect on internet leads?
The industry average for internet lead close rates sits around 10 to 12%, but the range is wide depending on lead source and response speed. Dealers who respond within sixty seconds close around 24% of leads, while those who take ninety minutes or longer close closer to 6%. Self-generated leads from your own website and organic search typically close at higher rates than third-party leads, and phone leads convert at roughly 74% appointment-set rate versus 40% for web forms.
When should I cut a marketing channel that isn't working?
If a channel has run for three months with a cost per sale above your average gross profit and you've already tried improving response speed and lead qualification, it's time to pause or cancel it. A channel that consistently delivers cost per sale over $1,000 or close rates below 5% is usually a reallocation candidate. The exception is a high-cost, low-volume channel that still produces positive net profit per sale — one expensive sale that nets you $500 is better than no sale, but it's not a channel you'd scale.
The Bottom Line
Cost per lead is easy to track and easy to game. Cost per car sold is harder to calculate and impossible to fake. It's the number that tells you whether your marketing spend is turning into profitable sales or just burning budget on leads that don't close.
The math is simple: spend divided by sold units. But getting the attribution right, tracking close rate by channel, and tying gross profit back to the source takes process. Most small lots don't do it because the platforms hand you cost per lead automatically and cost per sale requires manual work. That's exactly why the dealers who do run the math have an edge.
If you're spending money on marketing and you don't know your cost per sale by channel, you're flying blind. Pull the numbers this month, build the spreadsheet, and sort by cost per sale. You'll find at least one channel that's quietly losing you money — and at least one that's working better than you thought.
14-day free trial, then $29/mo · Cancel anytime