# Gross Profit Per Car by Price Range: What an $8K Car Really Nets vs. a $25K Car
> Gross profit per car by price range, explained: why dollar gross and markup percentage move in opposite directions as price climbs.
- Source: https://www.dealervlo.com/blog/gross-profit-per-unit-by-price-tier
- Published: 2026-11-01
- Updated: 2026-11-01
- Author: Chris Abouraad
- Tags: gross profit, pricing strategy, inventory, used car dealers, stocking strategy
---
Ask ten dealers what a "good gross" looks like and you'll get ten different numbers, because the real answer depends entirely on where on the price spectrum you're stocking. Gross profit per car by price range isn't one number — it's two different games. A $25,000 unit and an $8,000 unit can both be "working," but they get there by completely different math, and a lot of lots lose money chasing the wrong one without realizing it.
The short version: as sticker price climbs, dollar gross tends to grow, but the markup percentage needed to hit that dollar gross shrinks. A $2,500 gross target is a big percentage bite on a cheap car and a small one on an expensive car. Neither is "better" — they're different businesses with different turn speeds, different risk, and different volume requirements. This post walks through the mechanics so you can decide which tier actually fits your lot, your cash, and your reconditioning capacity.
Track all-in cost and real gross on every car, cheap or expensive, in DealerVLO: start your 14-day free trial
## Why the same dollar gross is a different percentage at every price point
This is the core mechanic, and it isn't industry folklore — it's how a company like CarMax has described its own pricing approach in SEC filings: they target a dollar range of gross profit per used unit, and that target is based on things like probability of sale and mileage relative to age — not primarily on the vehicle's selling price (SEC EDGAR, CarMax 10-Q). In other words, the big retail players aren't trying to hold a flat percentage markup across their lot. They're trying to hold a flat *dollar* number, and letting the percentage float.
Here's the arithmetic that falls out of that approach, using clean illustrative numbers (not a sourced percentage table — nobody publishes one, because it's just math):
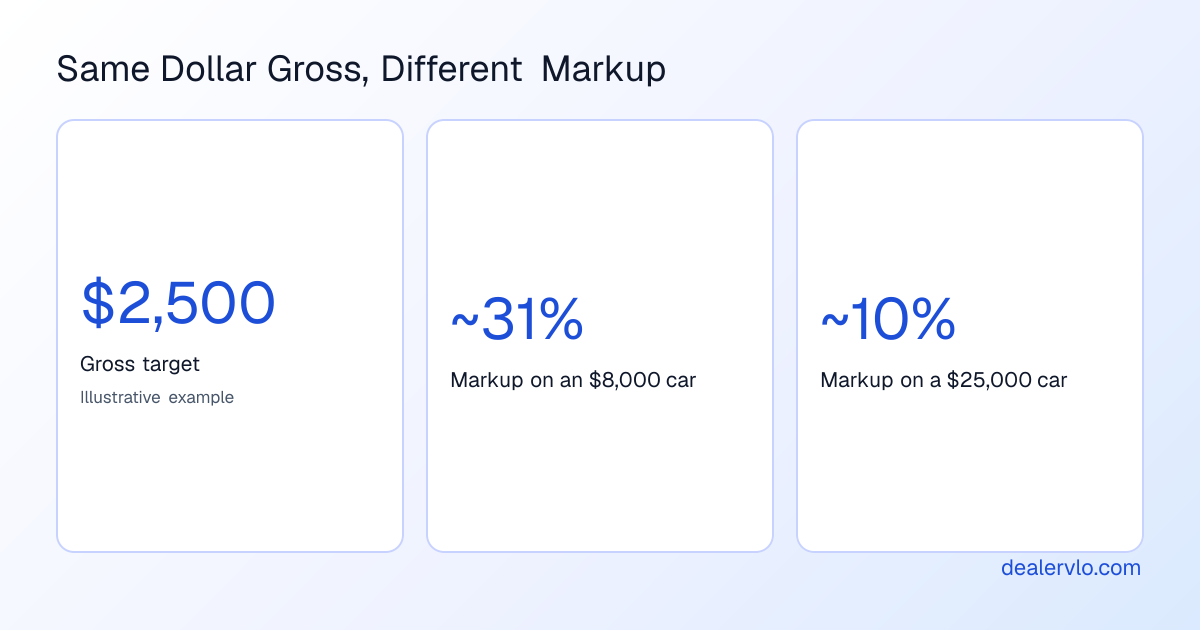
- A $2,500 gross target on an $8,000 car is roughly a 31% markup over cost.
- The same $2,500 gross target on a $25,000 car is roughly a 10% markup over cost.
Same dollar gross, wildly different percentage. That's the whole tension in the title of this post. If you're used to thinking in percentage markup, a $25K car "feels" like it's giving you less — until you look at the actual check that clears.
## What the actual numbers look like across the market right now
Before you pick a lane, it helps to know where the market sits today. Average used-vehicle listing prices have been climbing — Cox Automotive put the national average listing price at $27,239 in August 2026, about 7% above a year earlier (Cox Automotive). On the gross side, independent dealers in NIADA's 20-Group composite saw used-vehicle gross profit per unit average around $1,921 in early 2025, with F&I gross adding roughly $1,525 on top (NIADA). Franchise stores have seen it move differently — Presidio/NCM data put gross per used retail unit around $1,409 in Q2 2026, down from the prior year, while F&I per unit rose to about $1,769 (Auto Dealer Today / Presidio-NCM). Public dealer groups tracked by Haig Partners have run a bit higher, with used front-end gross per vehicle retailed bouncing between roughly $1,528 and $1,668 through 2025 (Haig Partners).
None of these numbers is "the" number for your lot — they're benchmarks from different segments (independent 20-groups, franchise stores, public groups), and NIADA's own annual Used Car Industry Report is the better source to dig into if you want segment-level detail for your specific size and market (NIADA UCIR). But the spread tells you something: a $1,400-$1,900 gross is a normal outcome on a $27K-28K average-priced unit in standard retail. That's your reference point for the higher-price tier.
| Tier | What it typically looks like | Typical dollar gross (benchmark) | Approx. markup % on gross target |
| --- | --- | --- | --- |
| Sub-$10K cash retail | Older, higher-mileage units, fast turn | Varies by lot — often a lower dollar gross, but a higher markup % relative to cost | Illustrative example: ~31% on a $2,500 target |
| Standard retail ($20K-28K) | Typical used-lot stock | ~$1,400-$1,900 (NIADA/Haig/Presidio benchmarks) | Illustrative example: ~10% on that gross |
| BHPH (deep subprime) | In-house financed, amount financed often around $12K | ~$6,000-6,100 gross per unit (NIADA, 2022 data — net of charge-offs and financing income) | Not a simple markup — finance-adjusted figure |
That BHPH row needs a caveat worth repeating: NIADA's buy-here-pay-here benchmark reports (via its 20 Groups and New Dealer Academy data) have shown gross profit per unit around $6,100, with amounts financed running a bit over $12,000 (NIADA). But that figure is explicitly net of bad debts and financing income in the standard BHPH benchmark methodology — it is not a cash markup over acquisition cost, it's a risk-and-finance-adjusted number from a completely different business model (SGC Accounting / NIADA BHPH benchmarks). Don't compare it apples-to-apples against a cash retail gross.
If you run BHPH notes, the dollar-gross number means little without also knowing what you'll collect and when.
## Turn speed is the other half of the decision
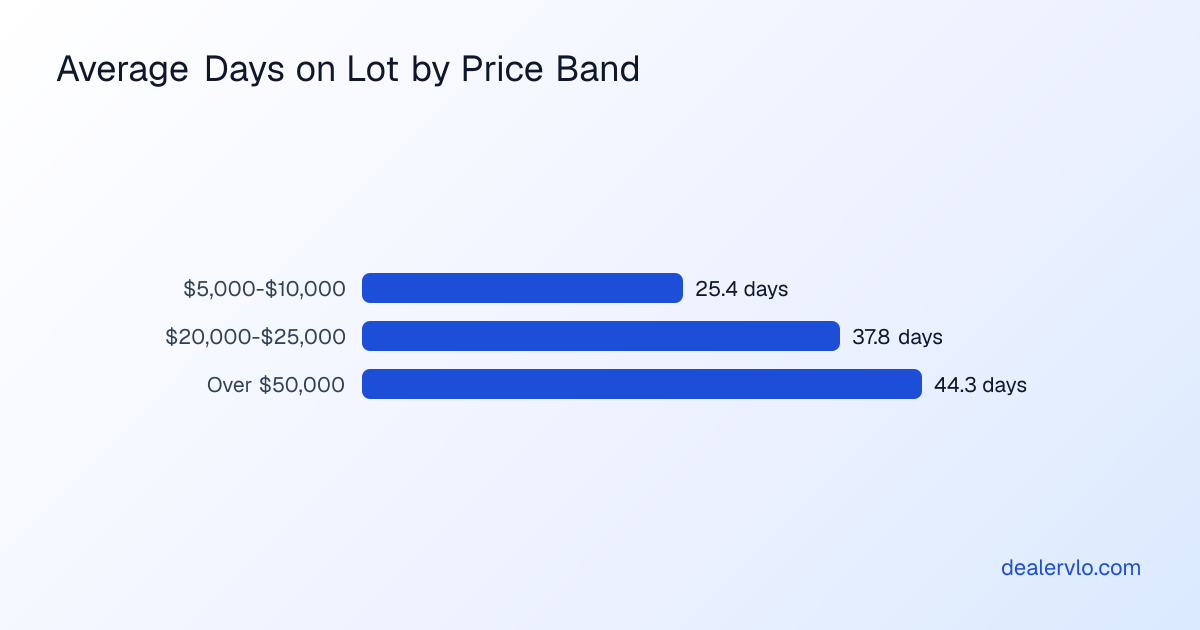
Dollar gross per unit only tells half the story — the other half is how fast that unit turns, because gross profit on a car sitting for months isn't the same as gross profit on a car gone in two weeks. Edmunds data reported by CNBC found a used car priced $5,000-$10,000 spent an average of 25.4 days on a dealer's lot, compared with 37.8 days for a $20,000-$25,000 car, and 44.3 days for anything over $50,000 (CNBC/Edmunds, Sept. 2026). Cheaper cars move faster. That's not a surprise, but it matters for cash flow: if you're running thin working capital, a lower dollar gross that turns quickly can out-earn a bigger dollar gross that sits for much longer.
This is also where the low end of the market is getting harder to stock. Cox Automotive found vehicles priced under $15,000 had only about 29 days' supply in August 2026 — 15 days below the industry average — and that price band's share of total used inventory fell from roughly 20.6% to 15.1% year over year (Cox Automotive). Cheap cars are scarcer and sell faster than they used to. At the same time, the cheap cars that are out there are getting older and higher-mileage: the average $10,000-$15,000 car was about 8.7 years old with roughly 98,222 miles in 2026, up from 4.7 years and about 58,250 miles back in 2019 (Edmunds, via CNBC). You're not stocking the same "cheap car" you were stocking five years ago — more of your gross on that unit is going to get eaten by recon before it ever reaches the lot.
That's the piece worth running the numbers on before you buy at the lane.
The Recon ROI Calculator helps you decide whether a specific repair on a specific car is worth doing before you authorize it, by weighing the recon cost and shop time against the retail value it adds. On a cheap, high-mileage unit where margin is already tight, that few minutes of math can be the difference between a deal that works and one that doesn't.
See every car's all-in cost — acquisition plus every recon line — roll into real gross in DealerVLO: try it free for 14 days
## Deciding which tier fits your lot
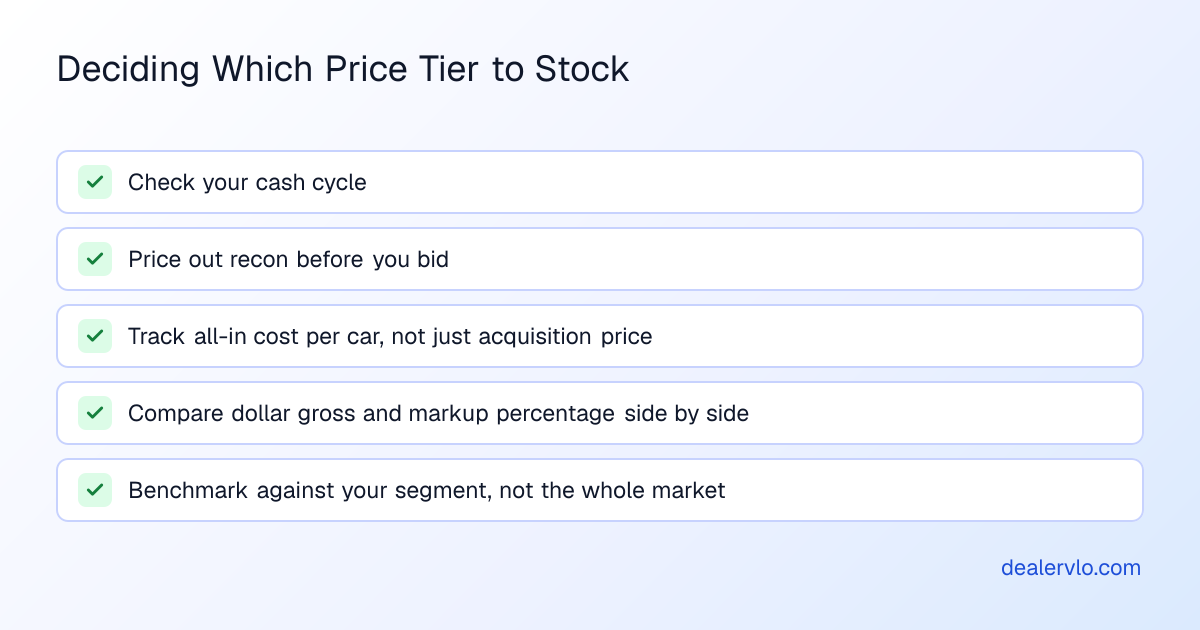
There's no universally "right" tier — it depends on your cash position, your recon capacity, and how much volume you can actually move through your lot. A few honest tradeoffs:
- **Low-price, high-turn** gives you faster cash recycling and smaller dollar checks per deal, but the units need more recon work relative to their value, and that inventory band is getting scarcer at auction.
- **Mid-price standard retail** ($20K-28K range) is where most of the NIADA and franchise benchmark data sits — a gross in the roughly $1,400-$1,900 range with moderate turn, per the sources above.
- **Higher-price units** carry bigger dollar gross potential per car but a thinner percentage margin, slower turn (per the Edmunds days-on-lot data), and more capital tied up per unit sitting on your lot.
If you're genuinely unsure which lane fits, run last month's actual numbers instead of guessing. If you run a small lot, you already know which units moved fast and which sat — the question is whether the ones that sat actually made you more money per day they occupied a spot.
And the [inventory turn rate guide](/blog/inventory-turn-rate-used-car-dealers) walks through how to calculate your own turn number and use it to benchmark against your tier — worth reading alongside this post if you haven't already.
## Where the paperwork and tracking side actually matters
Whatever tier you stock, you need to actually know your real number on every car — not your gut feel, and not a percentage you eyeballed off the sticker. A car's acquisition cost plus every recon line (sublet labor, a replacement key, a history report, an auction buy fee) is what determines its all-in cost, and gross on the deal is sale price minus that all-in number — not sale price minus what you paid at the lane. In DealerVLO, each car carries its acquisition cost and a running list of per-car recon and cost lines, so the sales report shows the gross you actually made, not the gross you assumed when you bought the car. That distinction matters more on cheap cars, where a modest recon surprise can eat a meaningful share of your whole gross target.
The same logic applies at deal time. DealerVLO computes deal math live — totals, trade equity, payment, front-end and F&I gross — so you see the real number before you print anything, not after you reconcile the month.
If you're trying to figure out which cars to even go buy for a given tier, the [monthly stocking report](/blog/cars-to-stock-september-2026) and the [guide to pricing used cars with the right markup strategy](/blog/how-to-price-used-cars-dealer-markup-strategy) are both worth reading alongside this one — this post is about the tier-level math, those are about picking the actual units and setting the actual price.
## Percentage markup vs. dollar gross: which should you actually track?
Track both, but know what each one is for. Percentage markup is a quick sanity check at the point of purchase — "am I buying this right relative to its cost" — but it's a poor way to compare a $9,000 car against a $24,000 car side by side, because the percentage math inherently favors the cheaper unit even when the dollar gross is smaller. Dollar gross is what pays your bills: rent, payroll, floor plan interest, your own draw. A lot that tracks only percentage markup can end up stocking a pile of cheap, high-turn units that look great on a spreadsheet but don't generate enough total dollars to cover a month's overhead.
This is also exactly the split that shows up in the P&L: gross profit is revenue (vehicle sales, F&I, doc and dealer fees) minus cost of cars sold (acquisition, one reconditioning total, F&I product cost), and then overhead comes out of that gross profit separately. DealerVLO's P&L report lays out that same structure for the period you pick — revenue, cost of cars sold, gross profit, then operating expenses by category — so you can see whether your per-car gross is actually covering what it needs to, not just whether each individual deal looked fine on its own. If you haven't built that statement out yet, the [guide to building a P&L for a used-car lot](/blog/build-profit-and-loss-statement-used-car-dealership) walks through the categories, and the companion piece on [gross profit vs. net profit](/blog/used-car-dealership-gross-vs-net-profit) explains why a healthy per-car gross number can still leave you with a thin or negative month if overhead outpaces it.
Run the deal math and see real front-end and F&I gross on every car in DealerVLO: start your free 14-day trial
## A note on data-driven pricing decisions
Dealers who actually track their numbers — rather than pricing off gut feel — tend to outperform those who don't. A 2026 Cox Automotive survey of franchise dealerships found that dealers who described themselves as "data-driven" hit their profitability goals at a meaningfully higher rate than those who didn't, and reported better gross profit per deal and better show-to-close rates (Cox Automotive). That survey covered franchise stores specifically, so take the exact figures with a grain of salt for an independent lot — but the directional point holds regardless of segment: knowing your real numbers, car by car and tier by tier, beats pricing by feel.
## Frequently asked questions
### Is a $1,500 gross on an $8,000 car worse than a $1,500 gross on a $25,000 car?
In dollar terms they're identical — both put the same $1,500 in your pocket. The difference is the markup percentage behind each (a much higher percentage on the $8K car than the $25K car) and the turn speed: cheaper cars in that range have historically sold faster, so the same dollar gross can cycle through your cash faster on the lower-price unit.
### Should I stock cheaper cars or more expensive cars to maximize gross?
It depends on your cash position and recon capacity, not a universal answer. Lower-price units tend to turn faster but are getting scarcer and older/higher-mileage at auction, which eats into margin through recon; higher-price units carry more dollar gross potential per car but tie up more capital and turn more slowly, based on the days-on-lot data by price band.
### Why do dealers talk about dollar gross instead of percentage margin?
Because a flat percentage target doesn't make business sense across a wide price range — it would demand an unrealistically high dollar gross on an expensive car and an unrealistically low one on a cheap car. Large retailers have described targeting a dollar range of gross profit per unit instead, adjusted for things like a car's probability of sale and mileage relative to age, rather than primarily by its price.
### Is BHPH gross profit comparable to standard retail gross profit?
Not directly. BHPH gross-profit benchmarks reported by NIADA are typically net of bad debts and financing income, meaning they already account for charge-offs and the lender-type economics of in-house financing — they aren't a simple sale-price-minus-cost markup the way a standard retail gross is.
### What's a realistic gross profit benchmark for my lot's price range?
For standard retail units in the roughly $20K-28K range, recent industry benchmarks from independent 20-groups, franchise data, and public dealer groups have generally landed somewhere between about $1,400 and $1,900 in front-end gross per unit, though your own number depends heavily on your market, acquisition costs, and recon spend. NIADA's annual Used Car Industry Report is the best place to check segment-specific benchmarks for your size and tier.
## Bottom line
Gross profit per car by price range isn't a single target you can borrow from a benchmark report — it's a tradeoff between dollar gross, markup percentage, turn speed, and how much recon risk you're willing to carry on each unit. Cheaper cars turn faster but offer thinner all-in margins and more recon uncertainty on older, higher-mileage stock; pricier cars carry bigger potential dollar gross but slower turn and more capital tied up per unit. The right answer is the tier that matches your cash, your recon bandwidth, and how fast you need that money back. Whichever tier you stock, know your real all-in cost and real gross on every single car before you decide it's working. See your actual numbers, not assumed ones, by running your next few deals through DealerVLO.
Run your next deal through DealerVLO and see your real gross by car and by tier: start your free 14-day trial
---
## FAQ
### Is a $1,500 gross on an $8,000 car worse than a $1,500 gross on a $25,000 car?
In dollar terms they're identical — both put the same $1,500 in your pocket. The difference is the markup percentage behind each (a much higher percentage on the $8K car than the $25K car) and the turn speed: cheaper cars in that range have historically sold faster, so the same dollar gross can cycle through your cash faster on the lower-price unit.
### Should I stock cheaper cars or more expensive cars to maximize gross?
It depends on your cash position and recon capacity, not a universal answer. Lower-price units tend to turn faster but are getting scarcer and older/higher-mileage at auction, which eats into margin through recon; higher-price units carry more dollar gross potential per car but tie up more capital and turn more slowly, based on the days-on-lot data by price band.
### Why do dealers talk about dollar gross instead of percentage margin?
Because a flat percentage target doesn't make business sense across a wide price range — it would demand an unrealistically high dollar gross on an expensive car and an unrealistically low one on a cheap car. Large retailers have described targeting a dollar range of gross profit per unit instead, adjusted for things like a car's probability of sale and mileage relative to age, rather than primarily by its price.
### Is BHPH gross profit comparable to standard retail gross profit?
Not directly. BHPH gross-profit benchmarks reported by NIADA are typically net of bad debts and financing income, meaning they already account for charge-offs and the lender-type economics of in-house financing — they aren't a simple sale-price-minus-cost markup the way a standard retail gross is.
### What's a realistic gross profit benchmark for my lot's price range?
For standard retail units in the roughly $20K-28K range, recent industry benchmarks from independent 20-groups, franchise data, and public dealer groups have generally landed somewhere between about $1,400 and $1,900 in front-end gross per unit, though your own number depends heavily on your market, acquisition costs, and recon spend. NIADA's annual Used Car Industry Report is the best place to check segment-specific benchmarks for your size and tier.